CHARTARMORY

Install app

  1. Use the install icon on the right of the address bar, or choose the app-install option in the browser menu. Chrome and Edge support this on desktop.
  2. Already installed? Open ChartArmory from your home screen or computer’s app list.
CHARTARMORY

App & notifications

Enable notifications

Only your selected topics. We store your push address, encryption keys, language and choices; turning notifications off deletes this subscription.

Push notifications are not supported in this environment.

← All productsCHARTARMORY · CRASH HOLDING AID

Storm Radar

Before you sell in a crash, check: noise or storm?

It shows the drop from the high and the volatility as weather (noise, correction, storm), so you don't sell in fear in the middle of a crash and miss the biggest rebound days.

$23.60One-time payment · Perpetual personal use
Add to my chart
One payment includes (yours to keep)
  • Full Pine Script v6 source code
  • 8-language panel and install guide
  • Personal use and editing rights (no redistribution or resale)
  • 30 days of bug-fix support after purchase
  • Copy button and TXT right after payment
View delivery and refund policy ↗
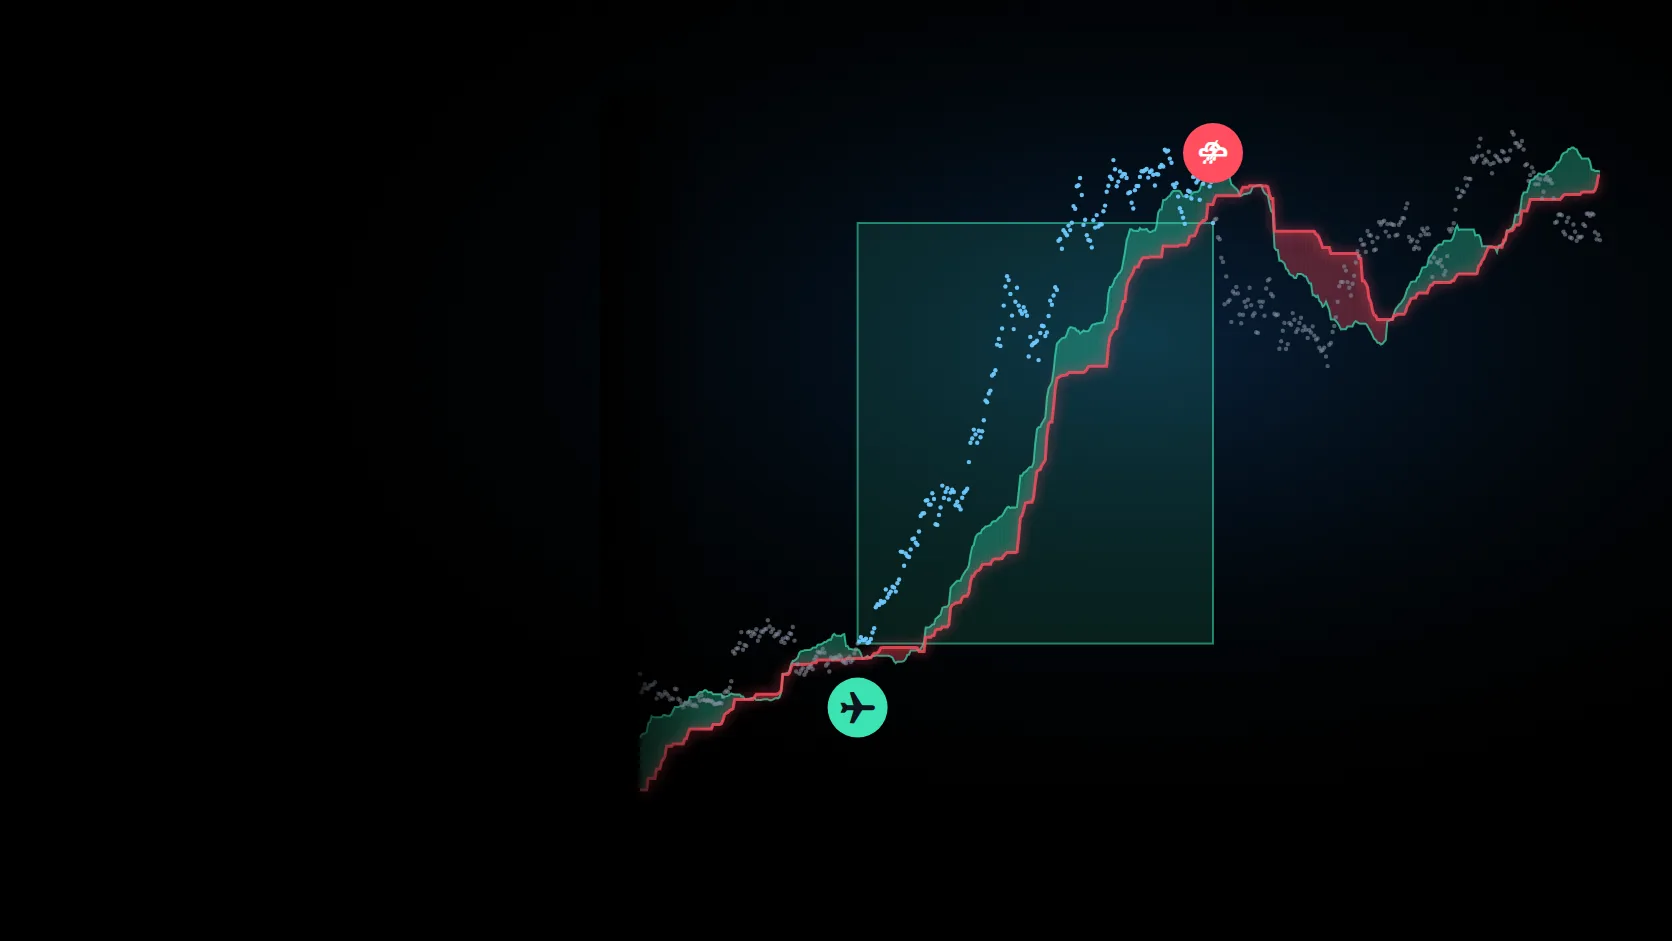
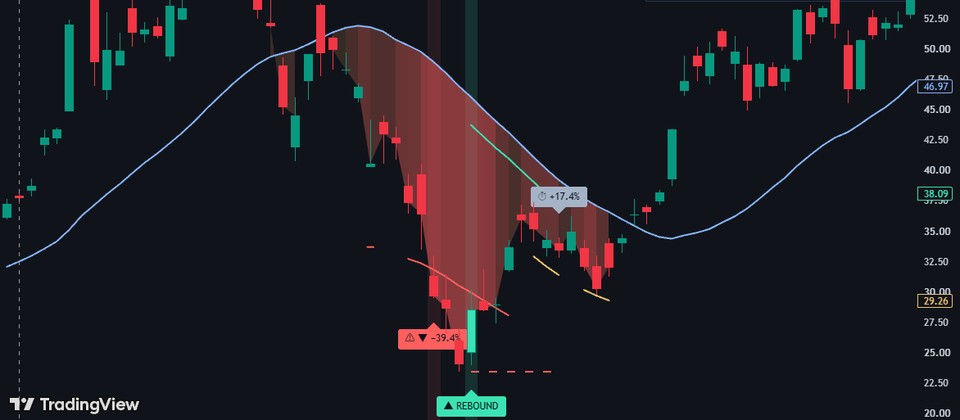
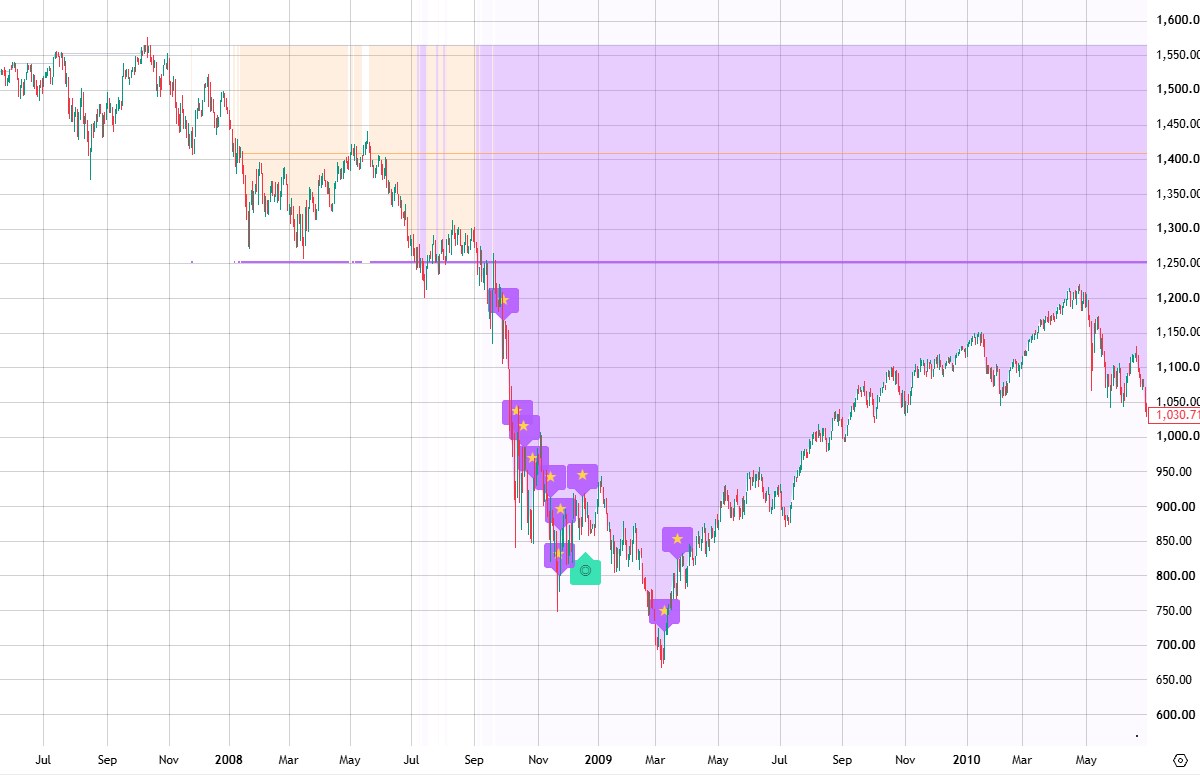
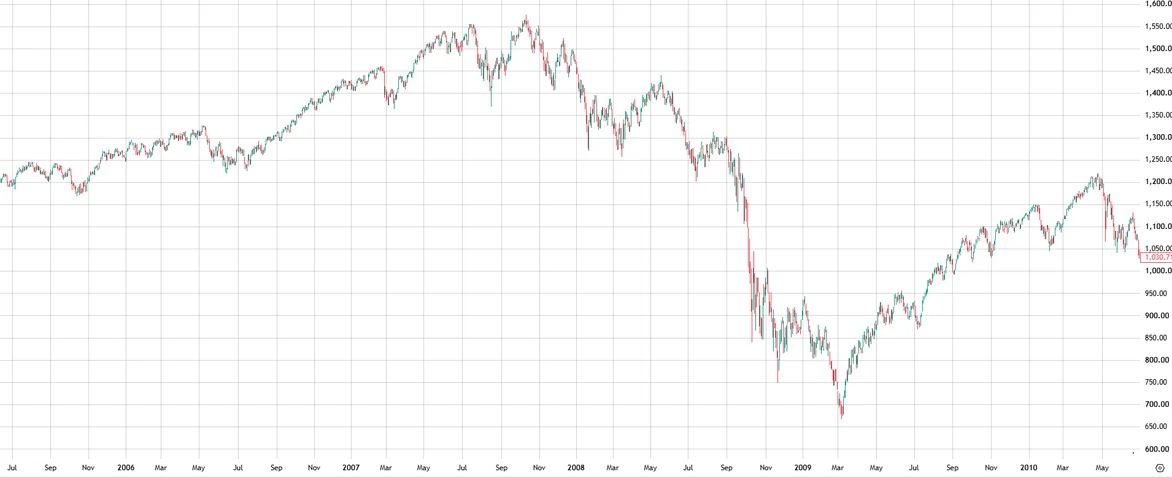
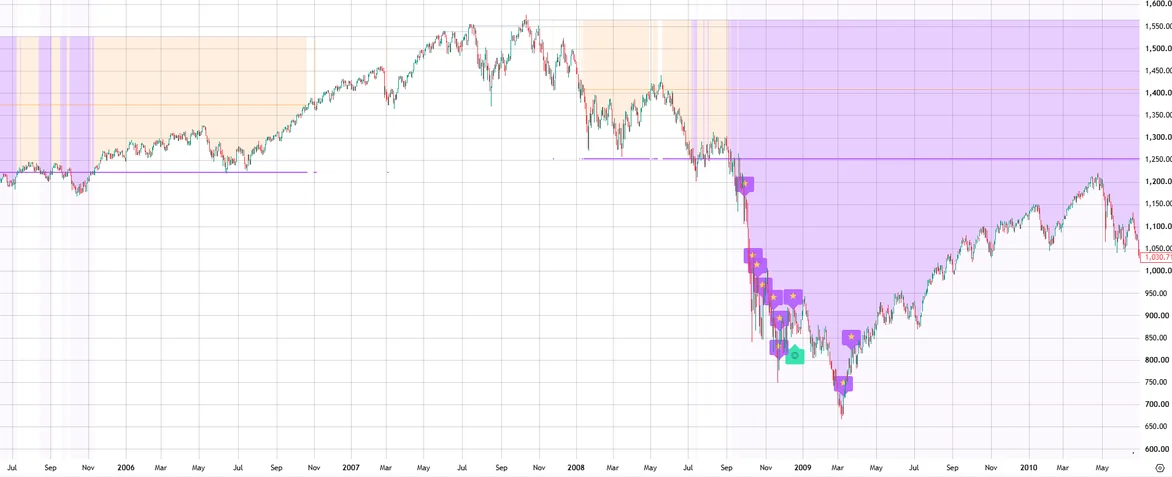
Read the market's weather by colour and stars, not by a tangle of numbers · S&P 500, the 2007–2010 financial crisis

Same chart. One indicator makes the difference.

Drag the handle to compare the chart with and without Storm Radar.

Before indicatorAfter indicator
Compare the SPX daily chart with and without Storm Radar · Before indicator
Compare the SPX daily chart with and without Storm Radar · After indicator

Calculated from historical data. Future returns are not guaranteed.SP:SPX · 1D · 2005.06–2010.06Chart: TradingView

PROBLEM → FIX

On days when crash headlines pour in, it takes these worries off you

  1. ProblemWhen the chart starts to fall you can't tell a passing wobble from a real bear market

    FixIt splits the daily close into noise (within −10%), correction (−10 to −20%) and storm (−20% or more, adjustable) in clear weather colours.

  2. ProblemYou sell in a panic and then miss the big rebound right after

    FixGold stars (★) on the chart and the panel's sentence show you that the best days cluster inside storms, giving you the strength to hold.

  3. ProblemYou check charts and news all day, wondering when it will calm down

    FixSet the four alerts (correction, storm, wind easing, back at the high) and keep the chart closed the rest of the time.

01 / WHAT IT DOES

Don't miss the real rebound inside the storm

01

Market weather and wind strength

On daily closes it colours the drop from the high in three steps: noise (within −10%), correction (−10 to −20%) and storm (−20% or more). It also measures how many times usual (the 1-year median) the last 20 days' swings are, and marks ◎ on the first day the wind falls 25% below the storm's strongest.
02

★ Best-day map

It puts a gold star (★) on the 10 biggest one-day gains in the period on your screen and counts, live, how many of them came inside a storm.

03

Weather panel and alerts at a glance

The panel at the bottom right shows the weather icon (☀/🌧/⛈), a 10-cell depth bar (1 cell = 4%), how many days the state has lasted and the date and price of the high, in 8 languages. Four alerts (correction, storm, wind easing, back at the high) and an optional past-replay table in the settings.

02 / EVIDENCE

Past data on 8 major markets

In all 8 markets, from stock indices to Bitcoin and gold, simply holding earned more per year than selling at the −20% storm line and buying back only when the old high returned.

Daily closes, 0.1% cost per trade | Compared: sell when the close falls 20% below the high, buy back when the old high returns, vs keep holding. Calculated on past data; it does not guarantee future returns.
MarketKeep holding (per year)Sold at the storm line (per year)10 best days inside storms
S&P 500 · 1927–6.2%333×2.6%12.3×10 / 10
S&P 500 TR · 1988–11.2%50.4×8.1%17.7×9 / 10
Nasdaq 100 · 1985–14.3%187×9.0%29.2×9 / 10
KOSPI · 1996–4.5%3.4×−0.5%0.9×9 / 10
Nikkei 225 · 1965–5.9%31.7×2.6%4.8×8 / 10
DAX · 1987–8.4%19.8×2.9%2.9×9 / 10
Bitcoin · 2014–67.7%204×13.3%3.6×6 / 10
Gold · 2000–9.8%9.6×5.4%3.6×2 / 10
  • Holding the S&P 500 with dividends for the 20 years 2005–2024 gave 7.18×; missing just its 10 best days left 3.29×, and 9 of those 10 days came in storms 20% or more below the high.
  • Assets where big crashes are rare, such as gold, had more of their best days outside storms (2 of 10). The tool is built for indices and index ETFs.
Trading without the indicator

What selling inside a storm costs

The biggest rebound days hide in the middle of the scariest crashes, so stepping out in fear means missing years of compounding.

With the indicatorKeep holding 6.2%

S&P 500 (from 1927), sold at the storm line (−20%) and bought back after the old high returned — 2.6% a year.

With the indicatorKeep holding 14.3%

Nasdaq 100 (from 1985), sold the same way — 9.0% a year.

With the indicatorKeep holding 4.5%

KOSPI (from 1996), sold the same way — −0.5% a year.

03 / INSTALL

Installed in about a minute

Use the copy button and the guide you get right after payment, paste it into TradingView and it works.

  1. 01On the payment-complete screen press the copy button for the Pine Script v6 source, or download the TXT.
  2. 02Open the Pine Editor at the bottom of your TradingView chart, paste the code and click Add to chart.
  3. 03In the settings pick your language from the 8, then adjust the weather thresholds and whether the past-replay table is shown.
Past performance does not guarantee future results.

Built independently by ChartArmory from the public drawdown and realised-volatility calculations.

NO REPAINT · NO FUTURE DATA

3 reasons you can trust it

  • Past signals stay put

    A signal on a closed bar never changes; only today’s unfinished bar can move.

  • No future data

    Other symbols and higher timeframes use only data available at that moment, so no future values leak into past signals.

  • Open raw data

    Past examples are calculated after trading costs (0.1% per side), and you can download the raw data as JSON.

Download raw JSON
INPUTS · PINE SCRIPT V6

Settings you can change

The exact names you see in TradingView’s settings (Inputs tab).8 languages supported

  • Correction starts: % below the high
  • Storm (hold zone) starts: % below the high
  • Wind: volatility window (bars)
  • Wind easing mark: % below the storm's strongest wind
A MORNING WITH STORM RADAR

A 5-minute daily routine

  1. Open the chart on the evening of crash headlines

    After the daily close, open the index chart and check the weather icon and the %-from-high bar in the panel at the bottom right.

  2. Noise or correction: let it pass; storm: look at the stars

    If it is a violet storm below −20%, see how many gold stars sit inside the storm on the chart.

  3. Check the wind, set alerts and close

    Look at how many times usual the wind is and whether ◎ appeared, then set the alerts and close the chart instead of selling in fear.

WHO IT FITS

Who it fits — and who it doesn’t

Recommended for

  • Office workers who can’t watch charts all day
  • People who want to stick to set position sizes and stops
  • Anyone for whom one chart check a day is enough

Not a fit for

  • Scalpers trading by the second or minute
  • Anyone hunting for a 100%-accurate “magic arrow”
  • People who trade by gut feel rather than rules
BUILD VS BUY

What would it cost to build?

Hiring a developer usually costs $2,000–$5,000+ and weeks of building and testing. Here, one payment gets you tested Pine Script v6 source right away, yours to keep.

Outsourcing
$2,000–$5,000+ · weeks of building and testing
ChartArmory
One payment · tested source, instantly
PAIR RECIPE

Indicators that work well together

Storm RadarCrash Ladder

Use Storm Radar to hold through the storm, and if you want to add more, let Crash Ladder set the staged buy levels below the high.

View indicator

Each indicator is sold separately; combined results have not been tested.

STORM RADAR / FAQ

Frequently asked questions

Does it give buy or sell signals?

No. It is not a trading signal that marks entries and exits; it is a holding aid that helps you resist selling in fear during a crash.

If I buy more in storms with it, will I beat plain holding?

No. It is not a rule that earns more than holding (a rule that raised exposure in storms did not beat holding either). Prices can keep falling after the storm line (45.6% more in 2008), it suits indices and index ETFs better than single stocks that may never recover, assets where big crashes are rare (such as gold) have many stars outside storms, and the stars are recalculated when you move the screen.

When the wind-easing mark (◎) appears, is that the bottom?

No. It only shows the first day the last 20 days' swings fell 25% below that storm's strongest wind; it does not guarantee the storm is over.

Can I change the noise, correction and storm thresholds?

Yes. The defaults are −10% (noise/correction) and −20% (storm) from the high, and you can change them in the settings to suit the asset. The hold vs sell-at-the-storm-line table can be switched on there too.

What files and support do I get?

One payment gives you the full Pine Script v6 source (copy button and TXT right after payment), the 8-language panel and install guide, and 30 days of bug-fix support. Personal use and editing are allowed (no redistribution or resale).

Can I edit or share the code?

You can edit it for personal use. Sharing, redistribution and resale rights are not included.

STORM RADAR / HISTORICAL CASE

The 2008 financial-crisis storm: the one who held and the one who got off

SP:SPX · 1D · 2008.07 → 2013.03+26.1%

After the storm line, a harsh winter with another 45.6% fall followed, but when the old high returned, the one smiling was the one who stayed.

The one who held
+26.1%
Storm line → back at the high
4 years 8 months

On 9 July 2008 the S&P 500 price index closed at 1,244.69, crossing the −20% storm line for the first time, and then fell another 45.6% to the 9 March 2009 low. Someone who sold in fear that day and came back only when the old high returned on 28 March 2013 still had the same cash (0%), while the one who sat it out was up 26.1% (the 2020 storm +36.6%, 2022 +29.1%, 2001 +29.7%).

  1. 01 / ⛈ Crossed the storm line1,244.69⛈ −20.5%
  2. 02 / Bottom (lowest close after the storm line)676.53−45.6%
  3. 03 / ☀ Back at the old high1,569.19☀ +26.1%
This trade+26.1%2008.07.09 → 2013.03.28
SPX · 1W · 2007.06.01 → 2013.06.28
1,7301,3591,068839.20659.40HoldingPeak $1,565▲ Buy $1,245▼ Sell $1,569
Hover the chart to read the date and priceRedrawn from the recorded trade’s closing prices. Average lines are recomputed as a visual guide.

S&P 500 price index daily closes (no dividends; the same index as TradingView SP:SPX) · the seller is assumed to wait in cash (no interest) until the old high returns

Download the calculation record (JSON) ↓
STORM RADAR · V1

Don't miss the brightest days while running from the storm

Keep Storm Radar on your chart and finish the course calmly, watching data and weather instead of the fear in the news.

$23.60One-time payment · Perpetual personal use
Add to my chart
CHARTARMORY STUDIO · CUSTOM INDICATORS

Can’t find the right indicator? Request a custom build.

Tell us the conditions and chart displays you have in mind.