Bought on great earnings news and got stuck?
Let the chart check first.
Did earnings grow from a year ago? Did price clear its one-year high on heavy volume? Where is your stop? EdgeBreak puts these three daily checks on one chart.
Keep the same rules every day without scanning charts by hand.
01Repeated manual checks
Less daily scanning
No need to check one-year highs and volume yourself. BREAK appears only on days when every condition is met.
02News-led decisions
No buying on news alone
Strong earnings alone show nothing. Price and volume have to break out together.
03Entry without a reference
Your loss limit, set in advance
When BREAK appears, a 7% warning line and an 8% stop line are drawn with it, so you know your limit before you act.
Feature illustrations, not actual prices or performance.
BREAK appears only when all three checks pass
Default settings · illustrative examples
01Earnings context
4 reports earlierLatest report
EPS growth of at least 25%
02Volume breakout
252-bar high + 1.5× volume
03Risk references
First candidate close · no automatic sale
See the exact rules
Earnings context · Compares this quarter's earnings per share (EPS) with the same quarter a year ago. No comparable report, no signal. Compare EPS with the report four releases earlier. Insufficient comparable data never qualifies.
Volume breakout · The close must clear the one-year high, with volume at least 1.5× the recent 50-day average. Observe a close above the prior 252 daily highs with at least 1.5× the previous 50-day average volume.
Risk references · Warning and stop lines are drawn 7% and 8% below the BREAK close. Enter your own buy price to draw them from that price. 7% warning and 8% stop reference from the first candidate close. Enter your fill price for separate guide lines.
02 / ON YOUR CHART
Here is how it looks on a chart.
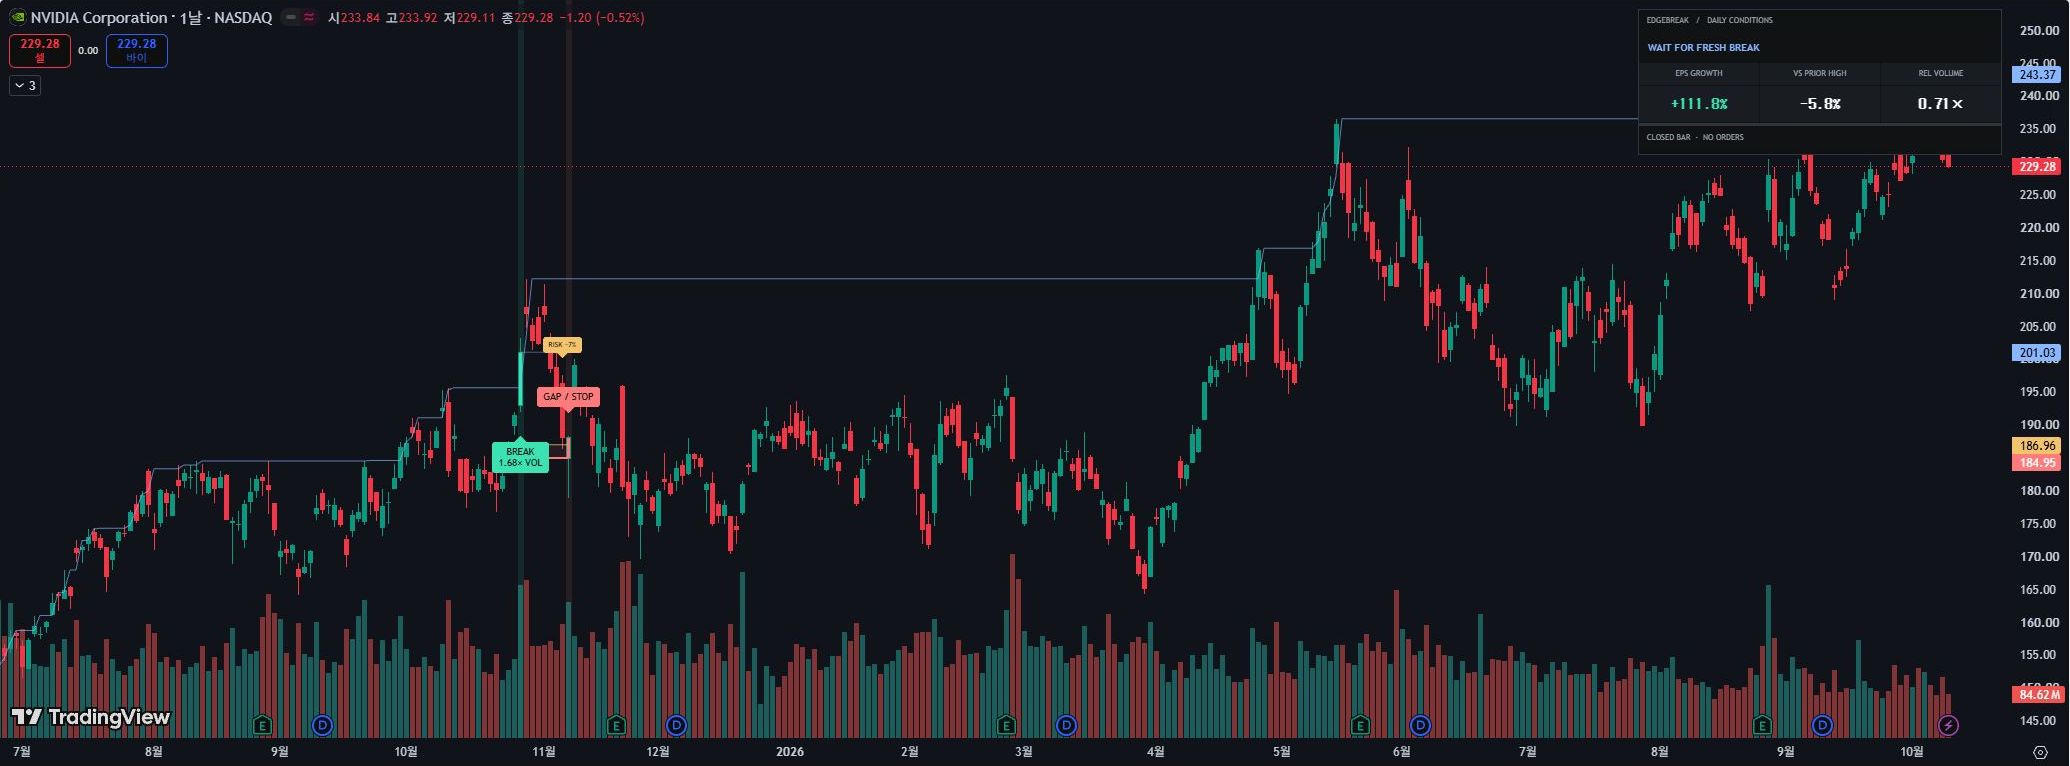
Three views from a real NVDA daily chart. Tap a view to enlarge it.
01 / Breakout candidate
Breakout candidate
BREAK appears after the day closes with every condition met. 1.68× VOL means volume was 1.68 times the usual.
02 / Risk references
Risk references
RISK −7% marks the warning line; the 8% stop line sits below it. GAP / STOP marks a day that opened below the stop line.
03 / Conditions panel
Conditions panel
The top-right panel shows earnings growth, distance to the breakout line and today's volume at a glance.
INTERACTIVE / −7% · −8%
Explore the reference levels
50500 · Price units
Illustrative calculation only, not market data or a return simulation. No automatic orders or loss protection.
Reference price0%
100.00
Warning level−7%
93.00
Stop reference−8%
92.00
03 / BEFORE · AFTER
From price movement to visible reference points.
AFTERQualifying days and risk references on the chartNVDA · 1D
Original TradingView captures · BATS:NVDA · 1D. Same range and price scale; only indicator visibility changes. Open at original size.
Complete Pine v6 code · installation guide · personal use/editing · 30-day bug support
01Download
02Paste into a new Pine indicator
03Add to a 1D chart
Paste and save the code, then add it to your chart. Use standard daily candles; adjust the rules in settings.
Before you buy
Standard 1D candles only. Earnings mode requires stock EPS reports. Crypto requires manually selecting Price only, which excludes earnings.
Report timing approximates quarterly cadence, not verified fiscal-quarter identity. EPS is not operating profit. Feed corrections and loaded history may change results.
Candidates and reference touches are confirmed after the daily close. No orders or intraday protection. Gap losses can exceed 8%. No future returns are guaranteed.
Current values can change before the close; candidates are confirmed at the close.
The indicator display supports Korean and English. TradingView accounts, plans and data fees are separate and not included.
Can I edit or share the code?
You can edit it for personal use. Sharing, redistribution and resale rights are not included.
EDGEBREAK / FAQ
Questions before you buy
Can I use it on TradingView Basic?
EdgeBreak occupies one indicator slot. Basic allows two indicators per chart, so you need a free slot. Technical alerts and market data are separate from indicator display and remain subject to TradingView plan and exchange limits.
Does it work with Korean stocks or crypto?
Use a standard daily candle chart. Earnings conditions for US or Korean stocks require available EPS and volume data for that symbol. For crypto and other symbols without EPS, select Price only to check price and volume conditions instead.
Can I install it without coding?
You do not need to edit the code. After payment, download and unzip the ZIP, then open the included Pine v6 code file in a text editor. In TradingView on desktop, paste the complete code into a new indicator in Pine Editor, save it and add it to your chart. Installation instructions are included.
EDGEBREAK · V1
Buy once. Install on your own chart.
Complete Pine v6 code · installation guide · personal use/editing · 30-day bug support