3-step split buying from the knees
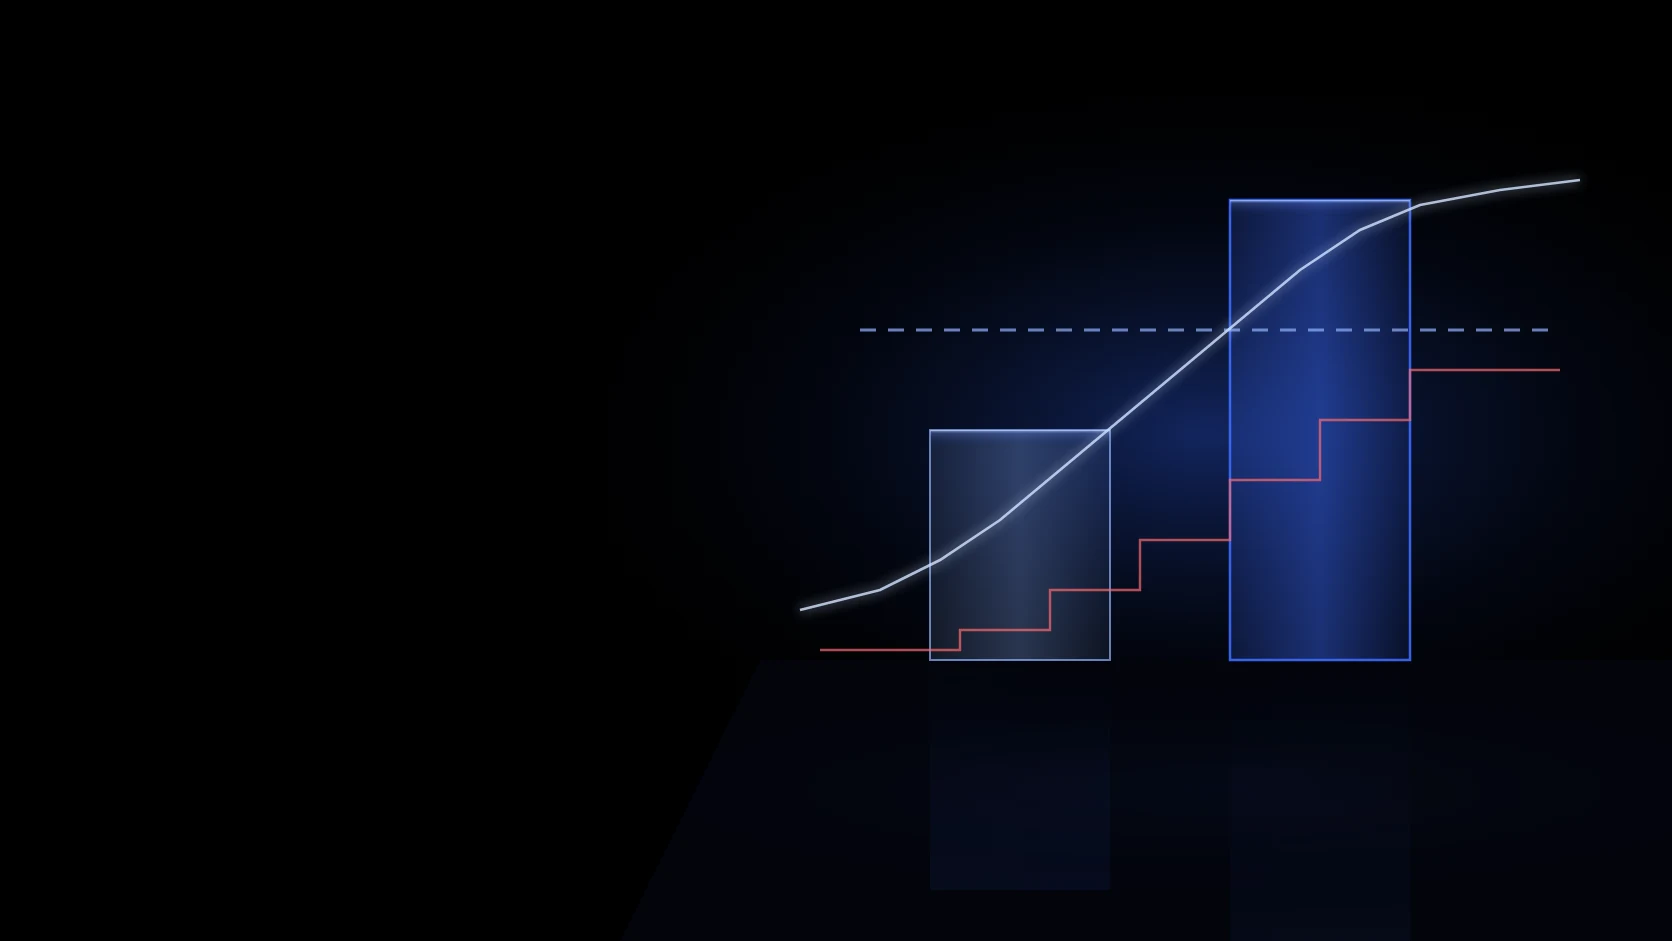
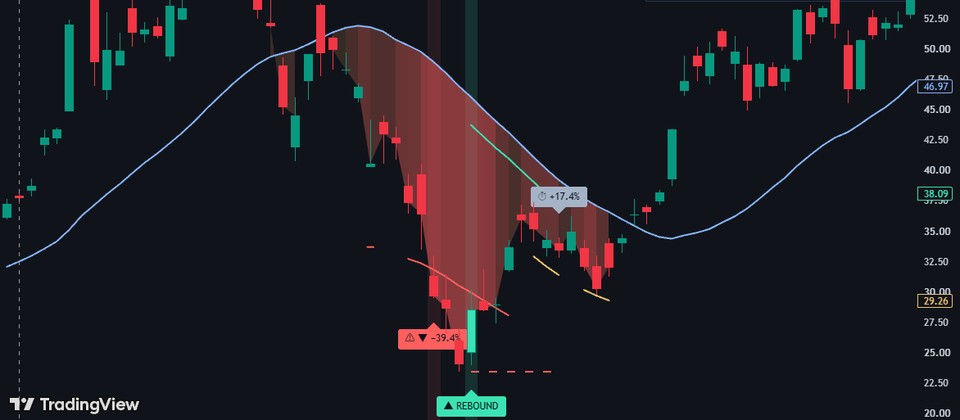
After −20·−30·−40% is reached it waits, buying a third only on a real rebound above the 40-bar highest close.
Set a ladder at −20·−30·−40% from the high, then climb on one third at a time once the fall stops.
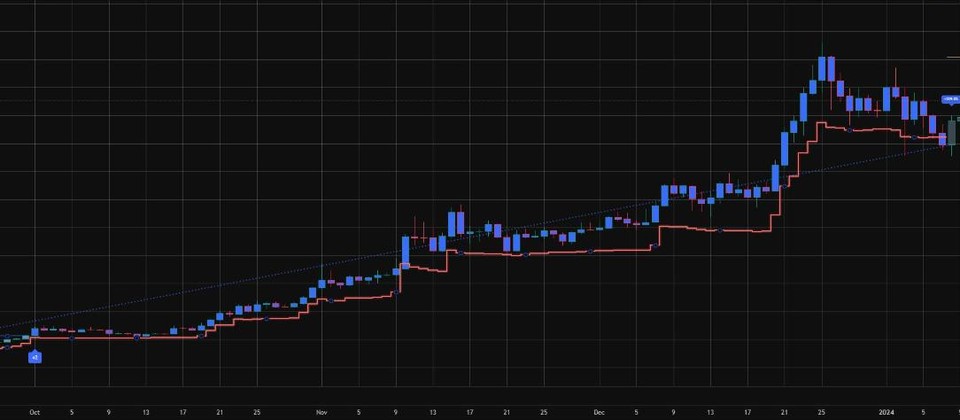
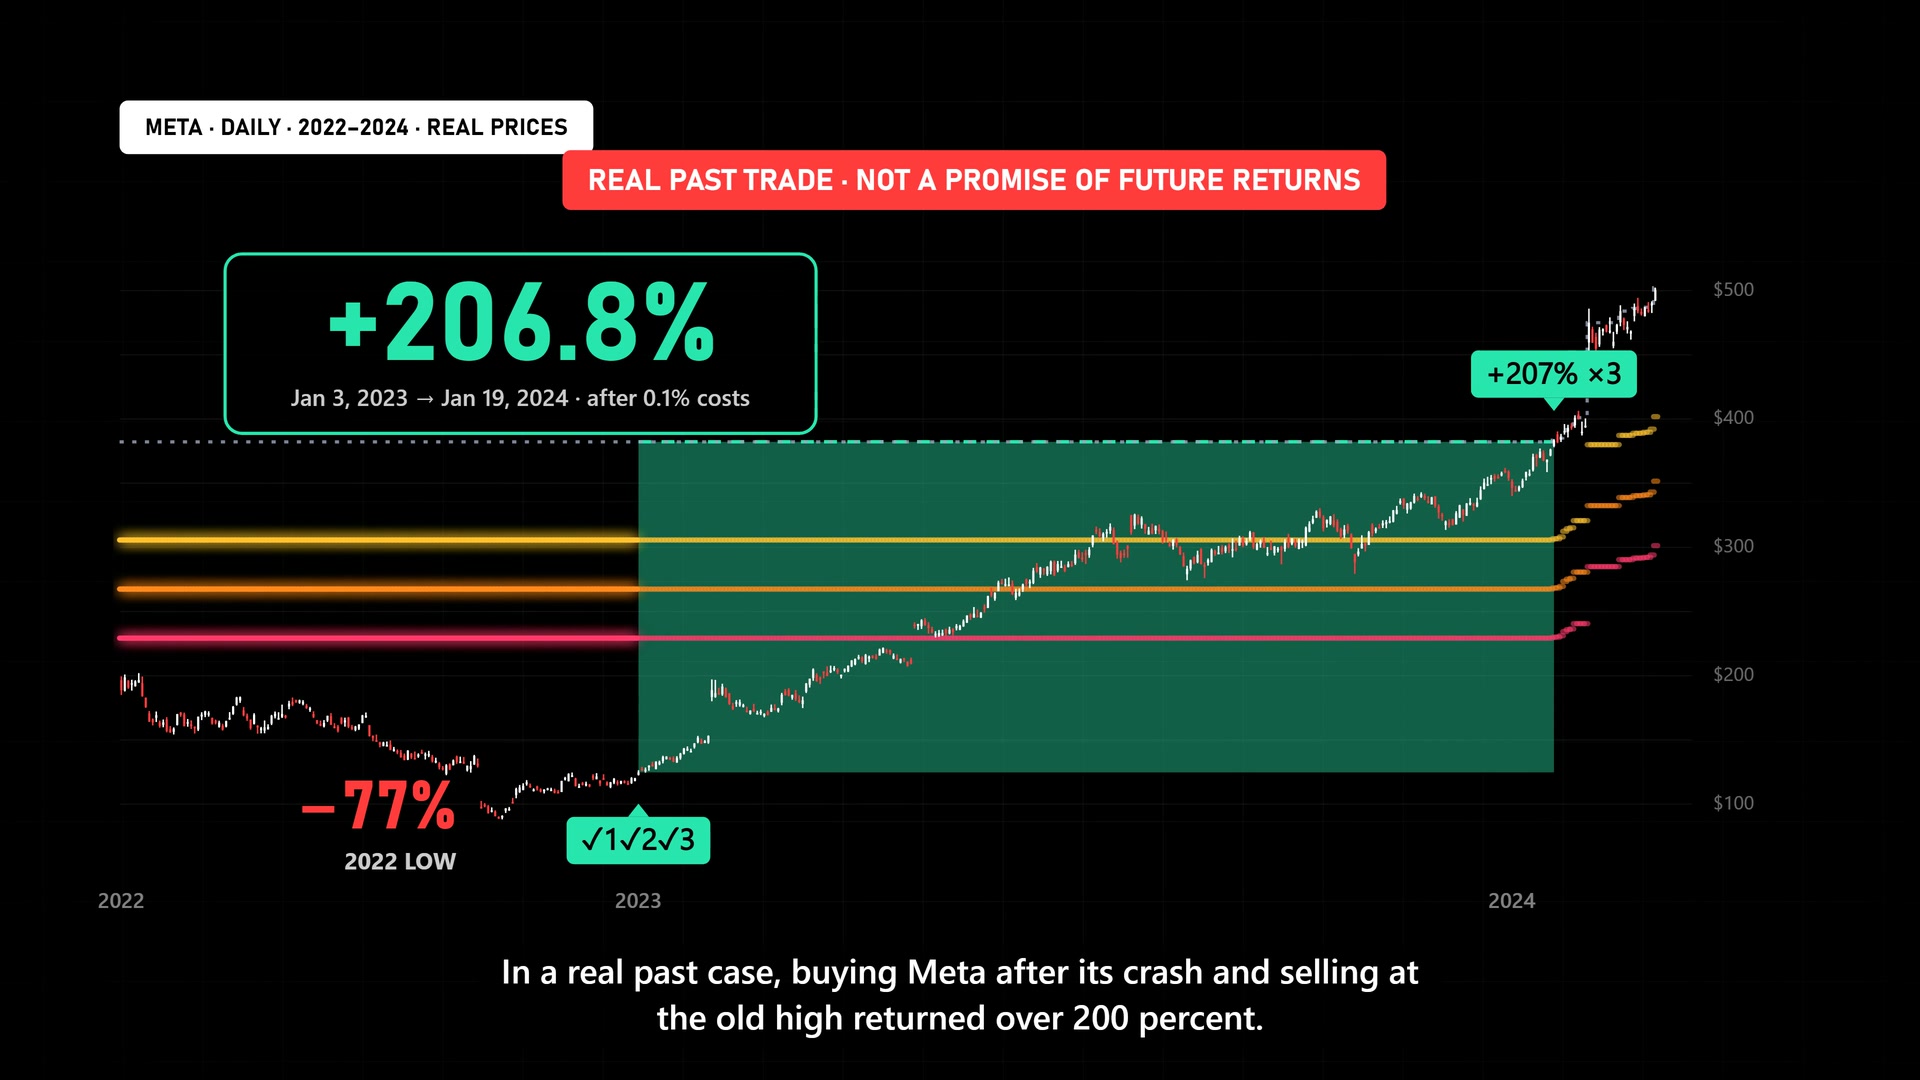
It waited while the price fell to $88.91, bought three rungs at $124.74 and sold at $383.45.
Not at META's $88.91 bottom: it bought all three steps in January 2023 once the rebound was confirmed, then made +206.8% per step at the old high.
Return = [sell close×(1−0.1%) ÷ buy close×(1+0.1%)] − 1 (taxes and slippage not included)
Download trade dataYou don't know when to buy in a crash, try to catch the bottom and miss it
The −20·−30·−40% rungs from the high are drawn in advance
You catch a falling knife and lose even more
It buys only after the drop stops (a close above the 40-bar highest close)
Fear makes you sell near the bottom
The sell target (the old high) is shown from the start
You have to watch the chart all day
You can set buy and sell alerts
After −20·−30·−40% is reached it waits, buying a third only on a real rebound above the 40-bar highest close.
It holds patiently for up to 756 bars (about 3 years) and sells the moment the pre-crash high is regained.
Confirmed at bar close, never repainted, with a real scorecard that includes 0.1% fees.
Three ladder steps, ✓1·✓2·✓3 buy marks and a mint profit zone are drawn clearly on your chart.
Trades, win rate, average return, worst trade and each step's status, all in one panel on the chart.
Full-history daily results, including a 0.1% cost on each buy and sell.
| Market | Since | Trades | Win rate | Avg trade | Worst trade |
|---|---|---|---|---|---|
| S&P 500 (SPY) | 1993 | 10 | 90% | +24.8% | −14.0% |
| NVIDIA | 1999 | 31 | 90% | +41.8% | −8.4% |
| Meta Platforms | 2012 | 15 | 100% | +61.8% | +4.4% |
| Tesla | 2010 | 26 | 100% | +30.1% | +2.4% |
| Bitcoin | 2014 | 21 | 100% | +31.5% | +2.3% |
| Chip index (SOX) | 1994 | 17 | 82% | +20.2% | −71.4% |
| Gold (GLD) | 2004 | 6 | 67% | +7.7% | −2.6% |
In a falling market, no rule means a bigger loss and a missed recovery. These are the actual numbers.
Copying short sellers — only 33% of 58 trades from 2000 to 2026 made money, and capital fell to 0.60×.
Selling the bottom — selling META at the 2022-11-03 close of $88.91 (−76.7% from the high) missed the +331% rebound to $383.45 by 2024-01-19.
The halved account — recovering a −50% loss needs a +100% gain.
Right after payment: a one-click copy button, a TXT file and setup guides in 8 languages.
Past performance does not guarantee future results.
Rules, visuals and scorecard are by ChartArmory. Bloomberg and S3 Partners, cited for market figures, are not affiliated with this indicator and do not endorse it.
No. One $59 payment, lifetime use.
All rules use the bar close, so a signal never redraws once it appears.
Yes. Drop depths, bar counts and every other value can be changed in settings.
Yes, 30 days of bug support after purchase.
You can edit it for personal use. Sharing, redistribution and resale rights are not included.
Put a clear rule on your chart: buy in parts once the fall stops, for one $59 payment, yours for life.
TOP WARNING
POSITION SIZING
TREND BREAKOUT
VOLATILITY BREAKOUT
LONG-TERM TREND
REBOUND OBSERVATION
BREAKOUT OBSERVATION
LIVERMORE · V3
TREND OBSERVATION
TradingView