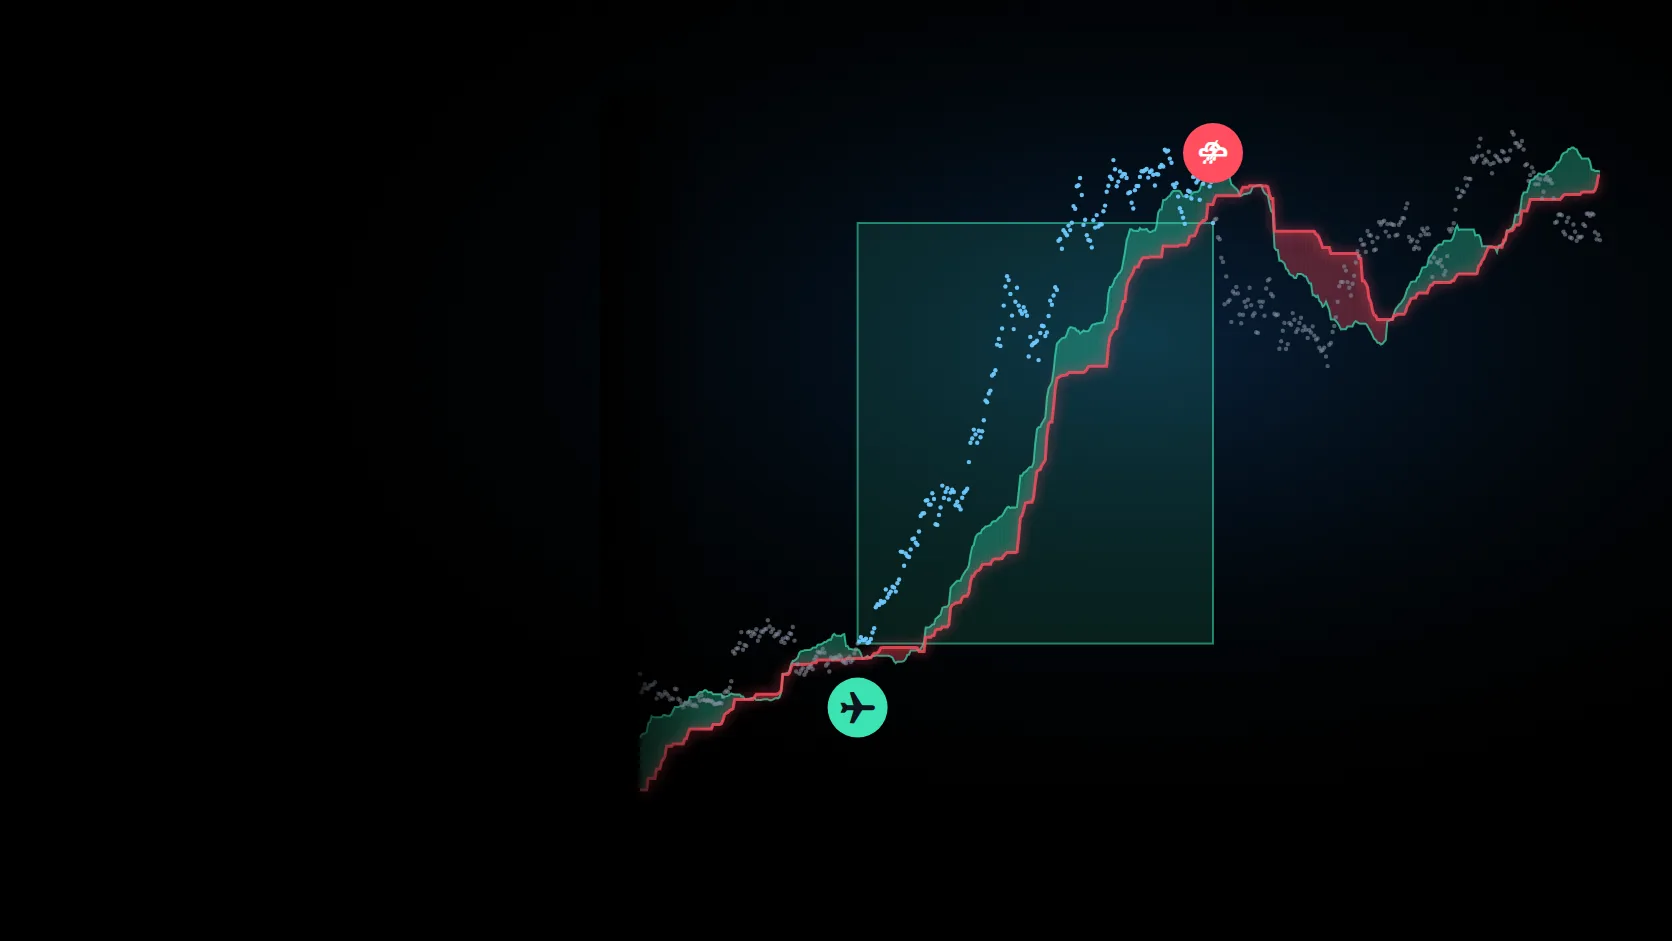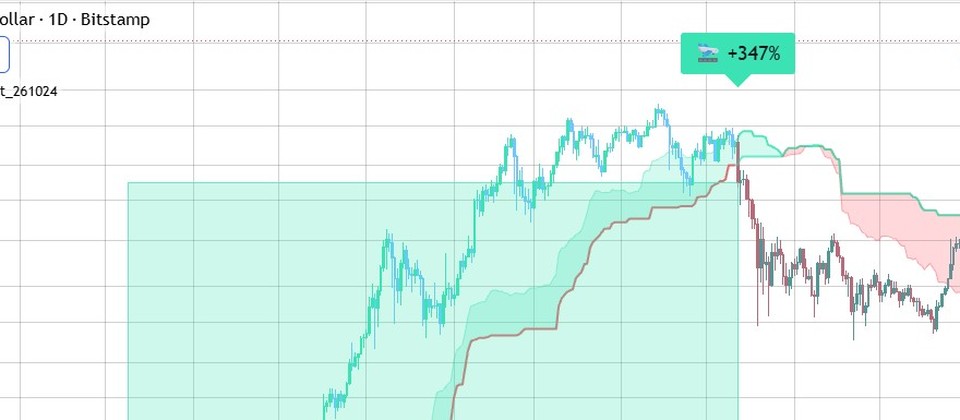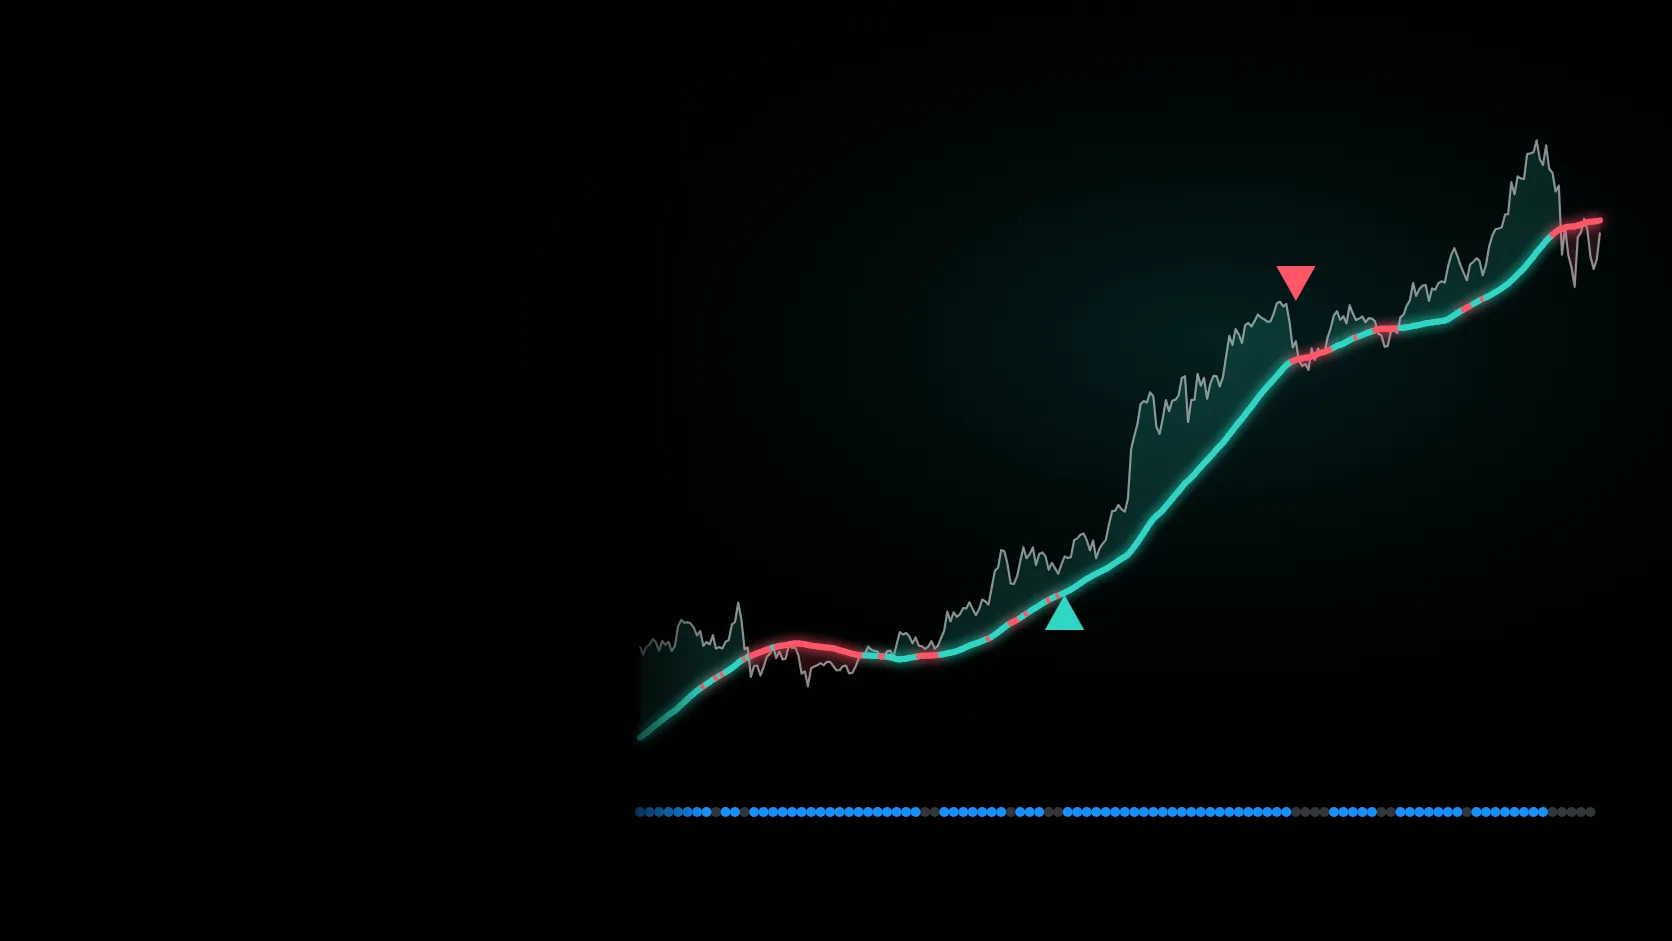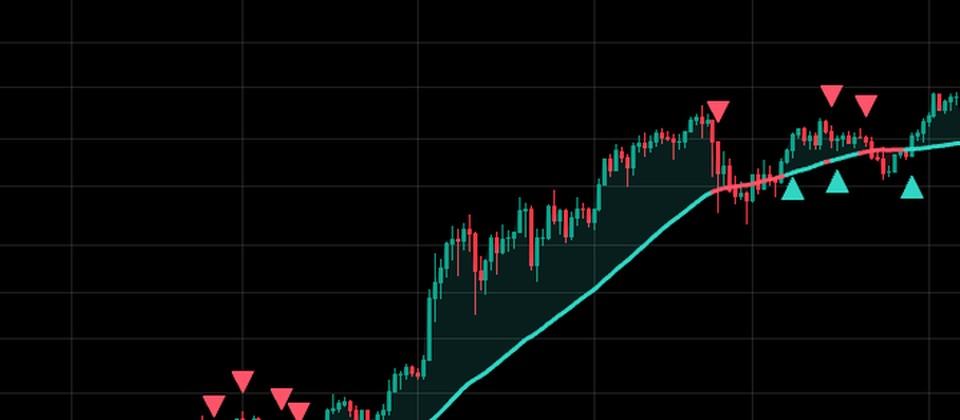
Weekly average candles behind the chart
Big weekly average candles are drawn behind your daily candles: mint for green, coral for red, grey for small moves under 1%. The big trend shows at a glance.
ChartArmory built the public Heikin-Ashi (average candle) method into crypto weekly candles. Check once a week, when the weekly candle closes.
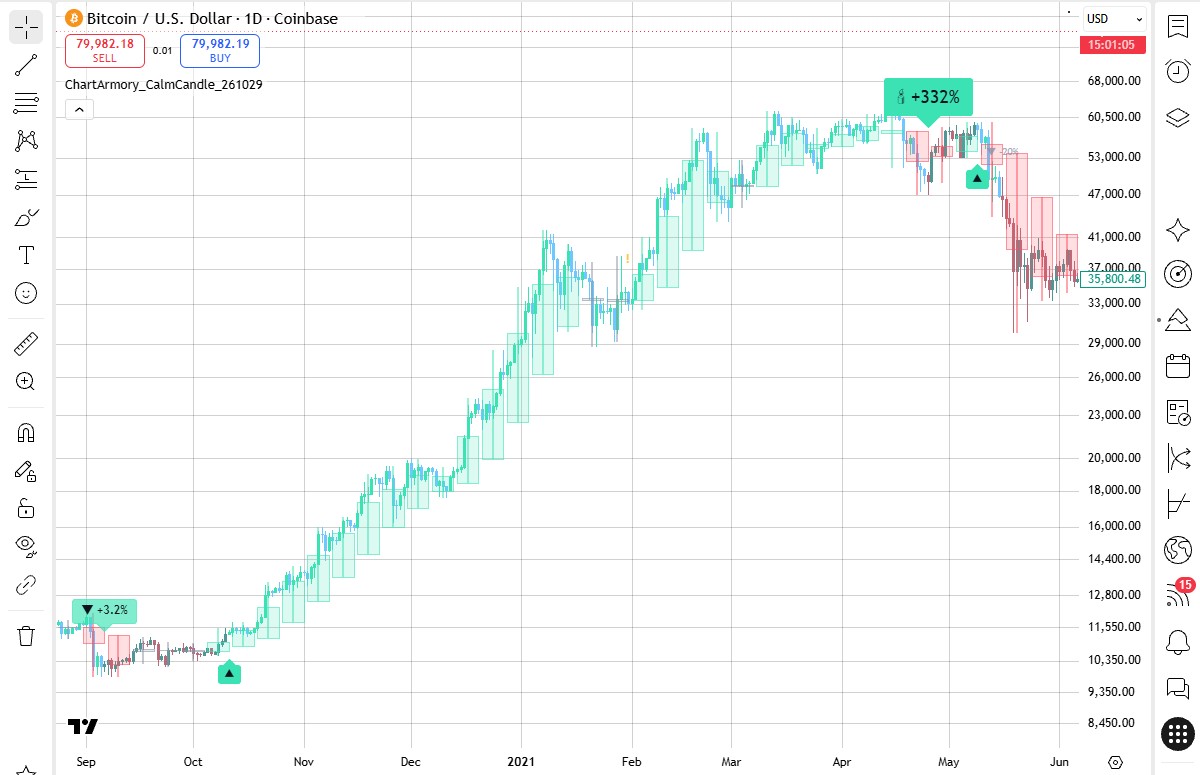
Drag the handle to compare the chart with and without Calm Candle.
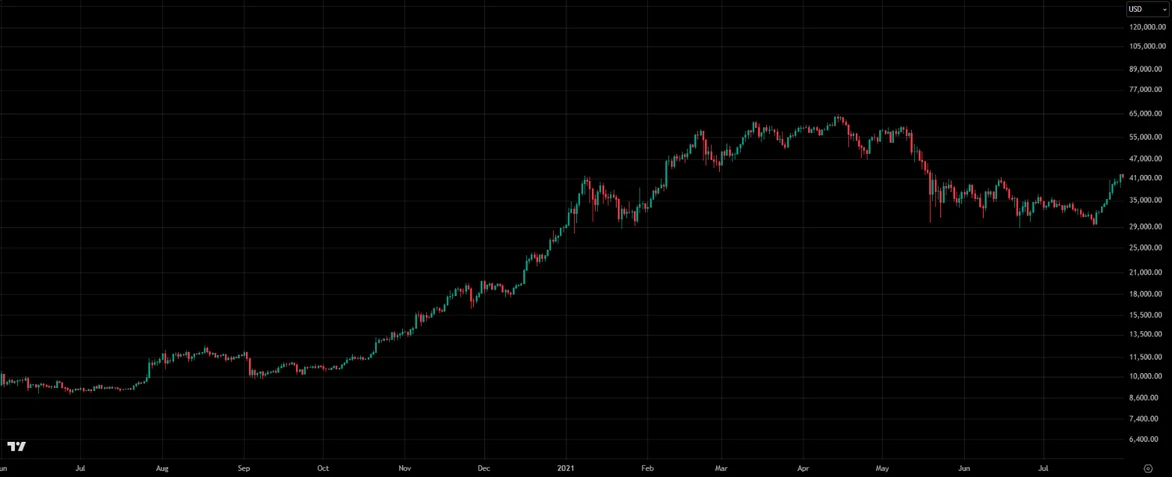
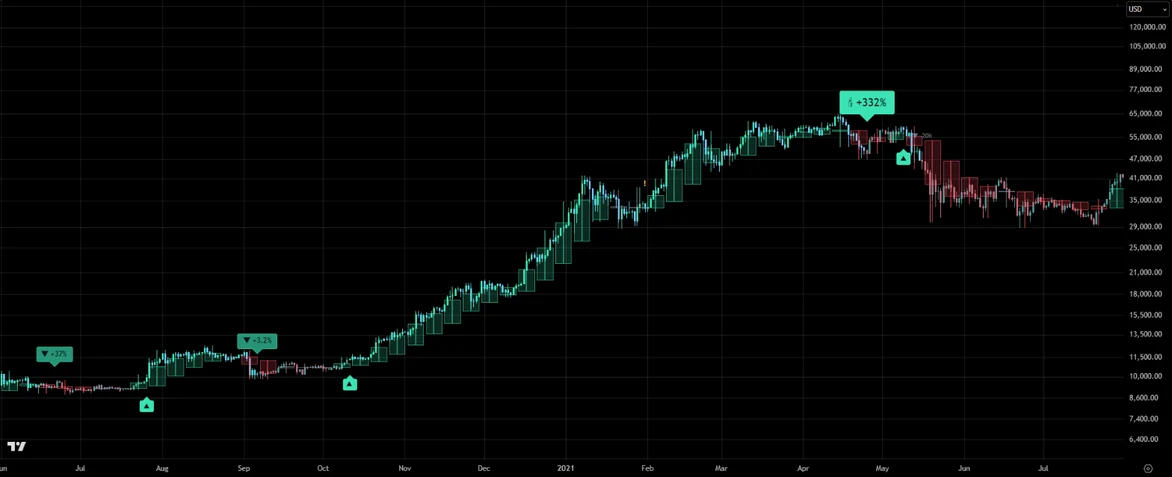
Calculated from historical data. Future returns are not guaranteed.BTCUSD · 1D · 2020.06–2021.07Chart: TradingView
ProblemDaily candles flip several times a day and you keep buying and selling
FixWeekly average candles behind the chart and the ignore-under-1% rule filter out the ripples
ProblemYou don't know at what price to act, so you stare at the chart
FixThe deciding-price line and the panel give this week's price as a number
ProblemWatching crypto charts all night wears you out
FixCheck once a week when the weekly candle closes, and act only when an alert comes
Big weekly average candles are drawn behind your daily candles: mint for green, coral for red, grey for small moves under 1%. The big trend shows at a glance.
When a week closes with an average-candle body more than 1% green, buy next week; more than 1% red, sell next week. Smaller candles are ignored. Set on the closed week, so it never repaints.
A dotted line and one sentence in the panel tell you which weekly close flips the signal. The panel also lines up the colours of the last nine weeks and this week like a calendar.
Bitcoin or cash only, no leverage, recorded to 28 October 2026.
| Start | Just holding | Calm Candle | Worst drop (hold → Calm Candle) |
|---|---|---|---|
| 2018 | $6,0306.0× | $14,34014.3× | −81.4%−51.5%▲29.9%pavoided |
| 2020 | $11,33011.3× | $12,04012.0× | −76.7%−51.5%▲25.2%pavoided |
| 2022 | $1,7001.7× | $1,8501.9× | −67.0%−41.3%▲25.7%pavoided |
Holding with no sell signal meant taking big crashes in full (real past records, 0.1% cost per trade).
With the indicator −43.6%
Bitcoin 2021.11–2022.11 bear market — holding −76.7%. The indicator sold in a red week and waited in cash.
With the indicator +4.3%
Bitcoin, the last year (2025.10–2026.10) — holding −34.9%.
With the indicator −13.3%
Ethereum 2017.12–2018.12 bear market — holding −88.7%.
No monthly fee: one payment and the full Pine Script v6 source is yours to keep and edit.
Past performance does not guarantee future results.
Built independently by ChartArmory from the public Heikin-Ashi calculation.
A signal on a closed bar never changes; only today’s unfinished bar can move.
Other symbols and higher timeframes use only data available at that moment, so no future values leak into past signals.
Past examples are calculated after trading costs (0.1% per side), and you can download the raw data as JSON.
The exact names you see in TradingView’s settings (Inputs tab).8 languages supported
Open the daily crypto chart right after the weekly candle closes (Sunday 24:00 UTC).
In the panel at top right, check last week's average-candle colour and this week's deciding price.
Move only in a week with a new ▲ buy or ▼ sell signal; otherwise close the chart and get on with your week.
Hiring a developer usually costs $2,000–$5,000+ and weeks of building and testing. Here, one payment gets you tested Pine Script v6 source right away, yours to keep.
Let Calm Candle decide when to hold and when to wait in cash, and Kelly Meter how much to put in.
View indicatorEach indicator is sold separately; combined results have not been tested.
A chart that averages each candle with the one before it to smooth out noise. Its inventor is unknown; it became widely known through a 2004 US magazine article. Candlestick charts themselves are often credited to the 18th-century Japanese rice trader Munehisa Homma, though whether he invented them is uncertain.
Fewer than half of the trades win (24 of 52). In sideways markets small losses (−8.5% on average) come several times, and one big trend (wins average +53%) makes up for them.
No. They are calculated only from the closed week and never repaint. The indicator places no orders.
No. Look once when the weekly candle closes (Sunday 24:00 UTC). Buy and sell alerts are available too.
You can add it to any daily chart, but the rule is tuned for crypto weekly candles such as Bitcoin and Ethereum. On stocks it did worse than just holding.
You can edit it for personal use. Sharing, redistribution and resale rights are not included.
Bought the day after a week closed more than 1% green, sold the day after a week closed more than 1% red. The small wobbles in between were ignored.
On 11 October 2020 the weekly average candle closed with a +2.95% green body, so it bought at the next day's open of $11,374.01. 28 weeks later, on 25 April 2021, the body closed −9.11% red and it sold the next day at $49,121. Within 90 days Bitcoin fell to $29,796.
Signal on the weekly close, filled at the next day's (Monday) open, 0.1% cost per buy and sell · a replay of the same rule as the TradingView indicator (Coinbase BTC-USD daily)
Download the calculation record (JSON) ↓Once a week, look only at the big colour of the weekly average candle and follow the trend calmly.
Crypto cloud trend tool
Crypto trend tool
Bitcoin cycle tool
TREND + HEAT SIZING
Breakout step checker
PULLBACK TREND
POSITION SIZER
LEADER ROTATION
TOP WARNING
CRASH BUYING
POSITION SIZING
TREND BREAKOUT
VOLATILITY BREAKOUT
LONG-TERM TREND
REBOUND OBSERVATION
BREAKOUT OBSERVATION
LIVERMORE · V3
TREND OBSERVATION
TradingView