No edge, no bet
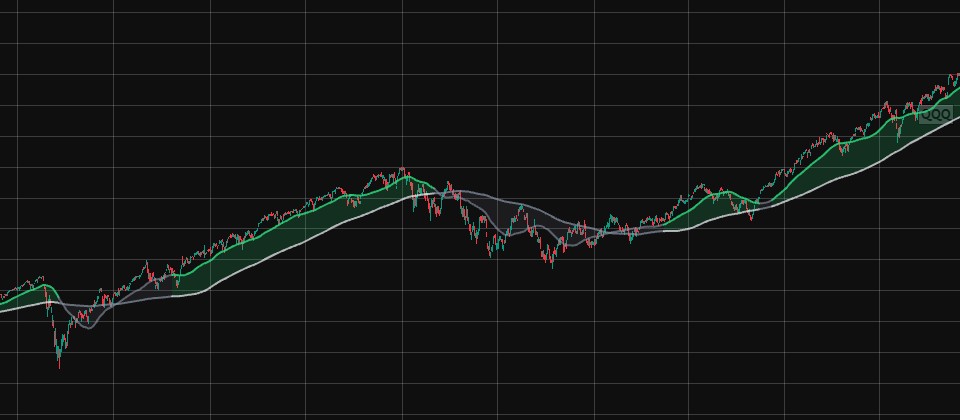
If the worse of the 1-year and 6-month average return turns negative, it goes to 0% (all cash).
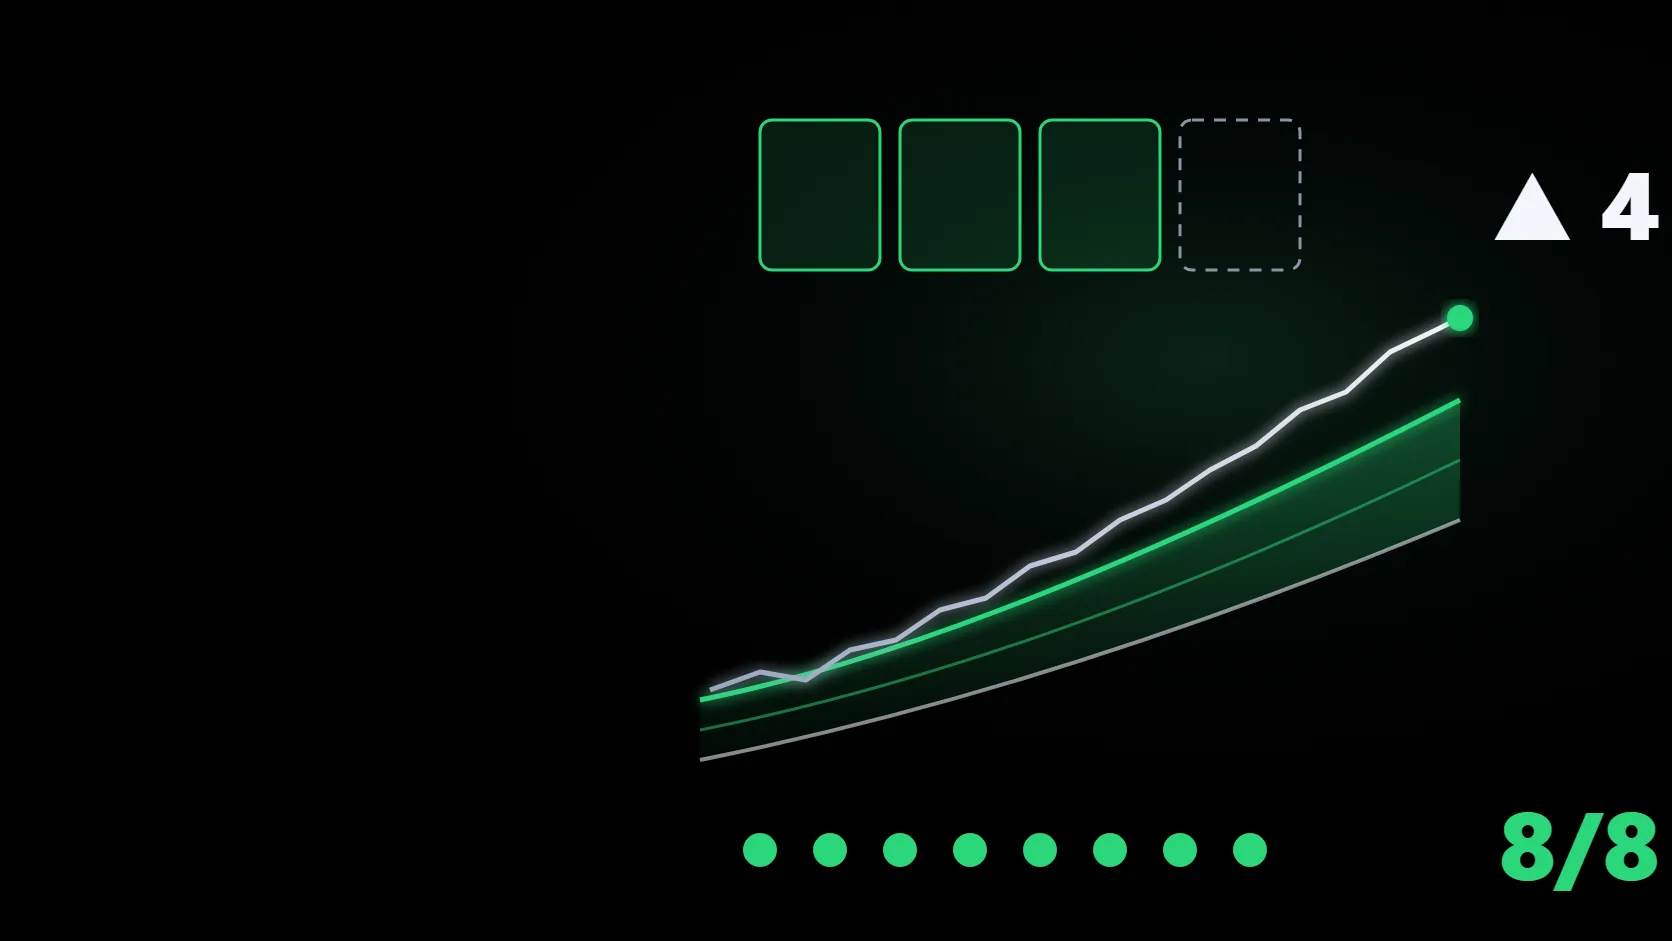
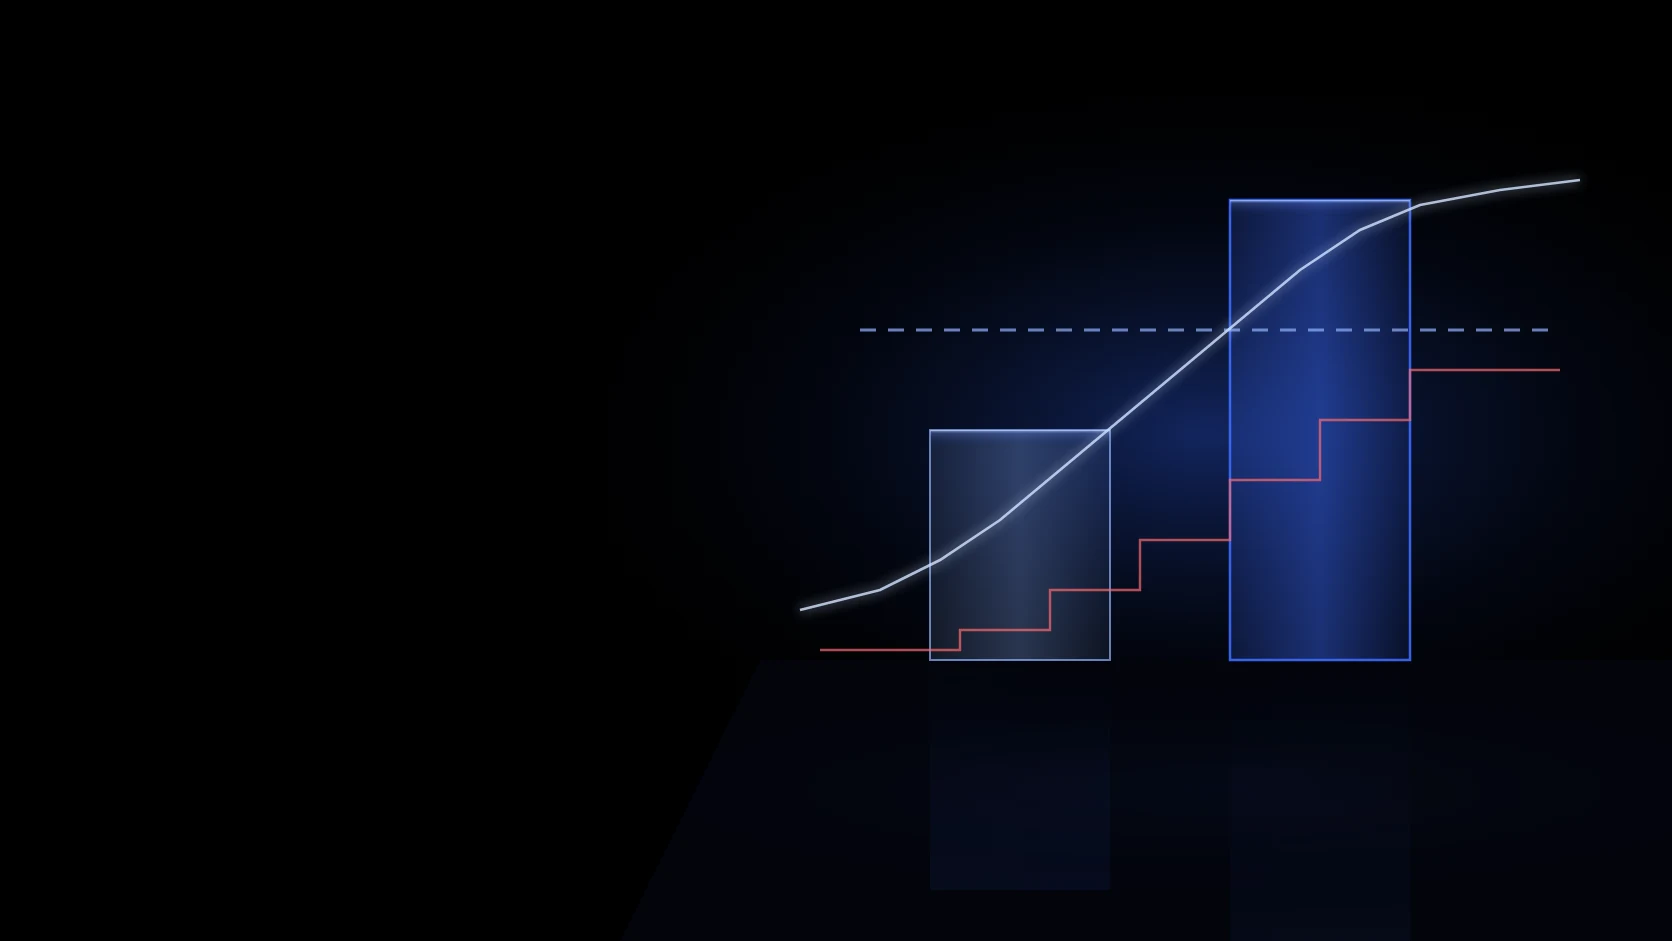
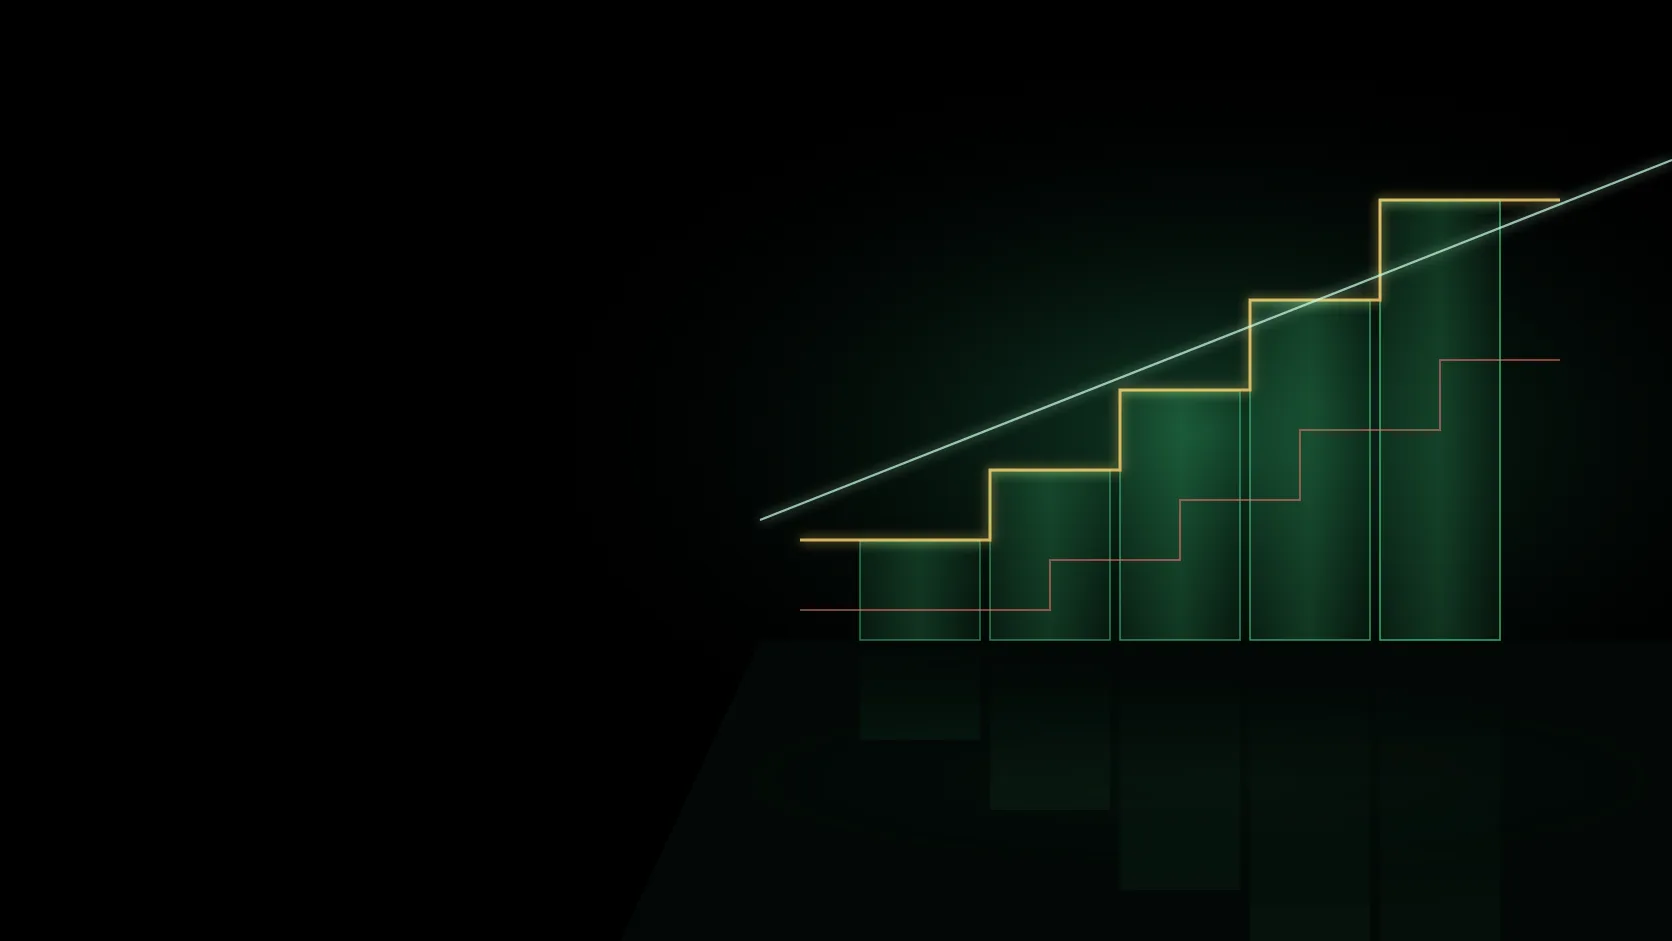
Ed Thorp's Kelly formula on your chart: how much to keep invested and how much in cash, in five steps from 0% to 100%.
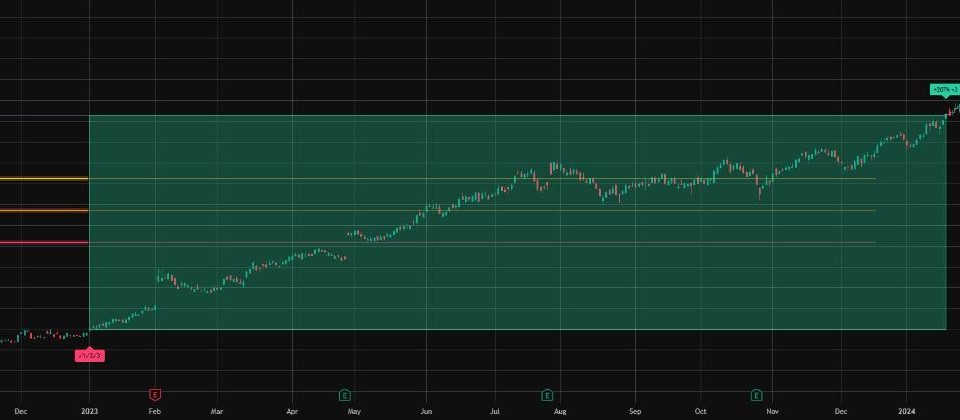
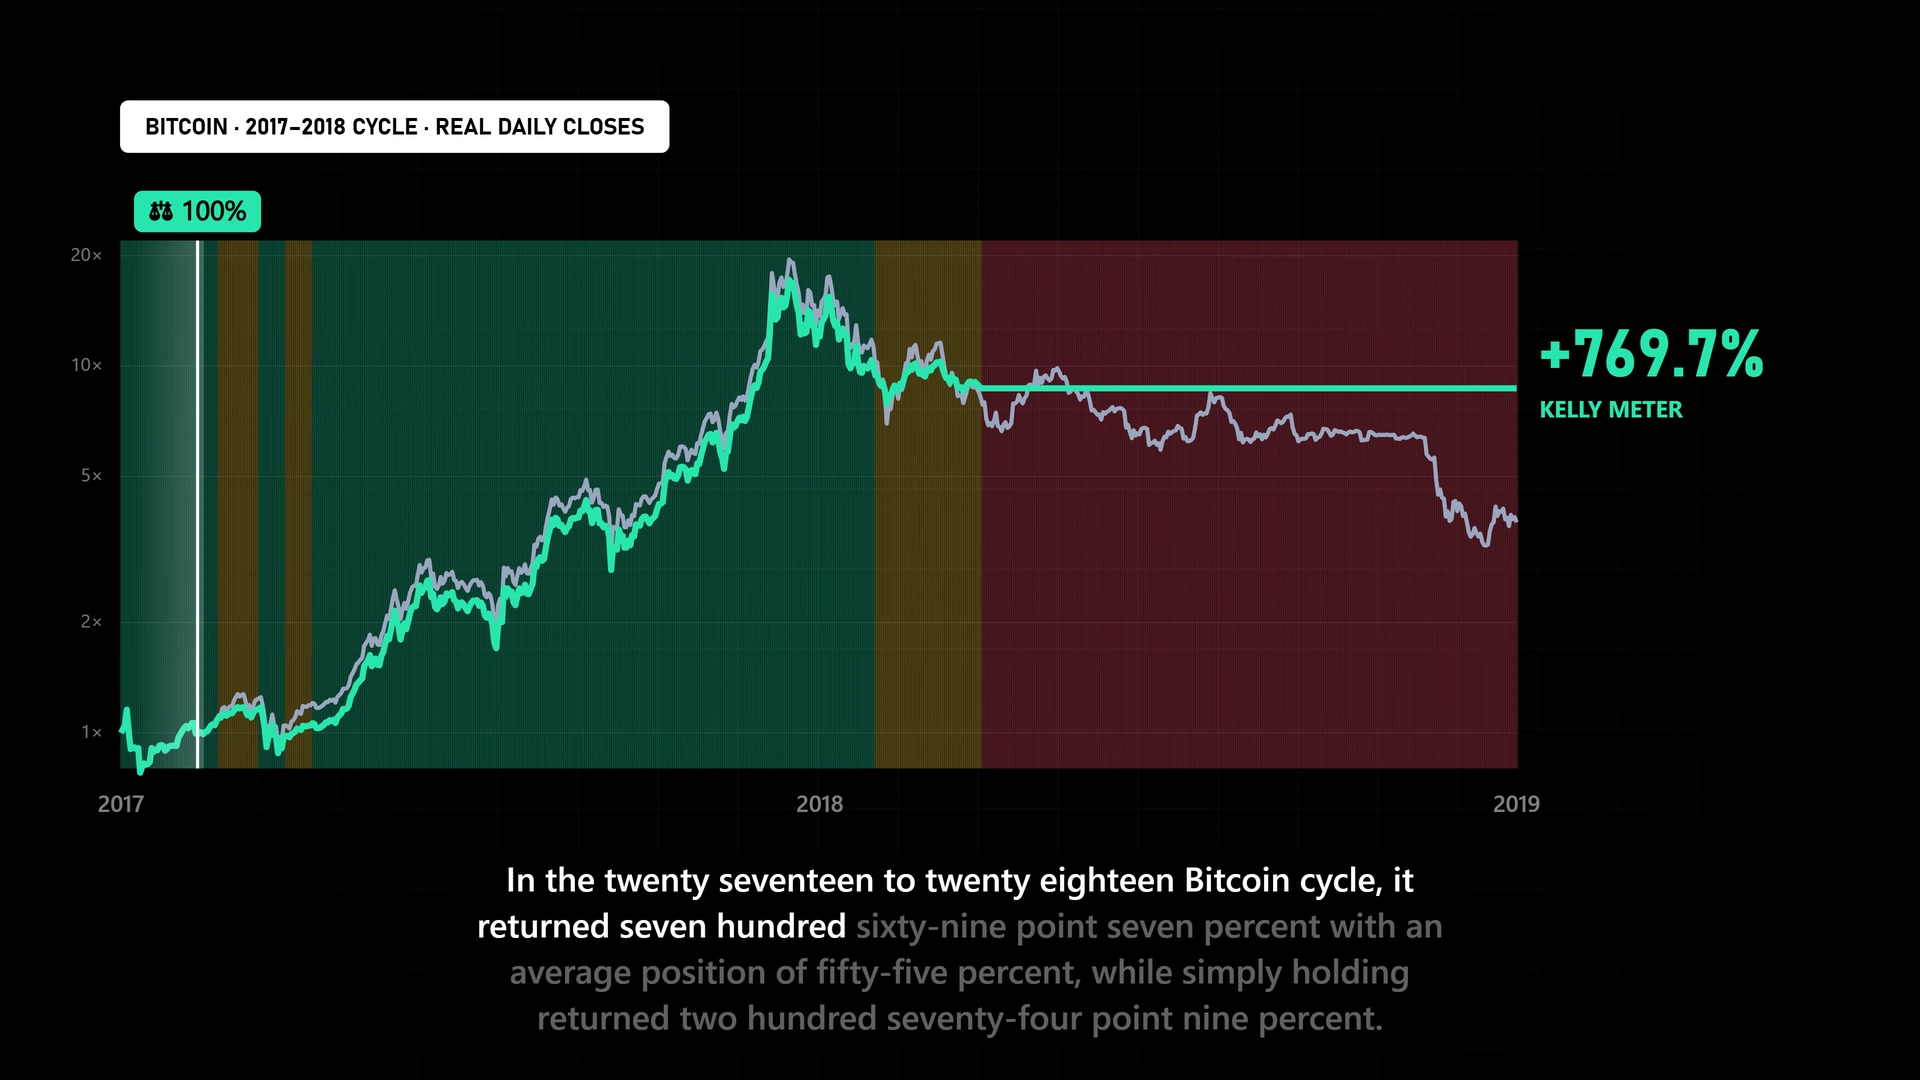
Over the same two years, holding returned +274.9% and Kelly Meter +769.7% (0.1% cost included).
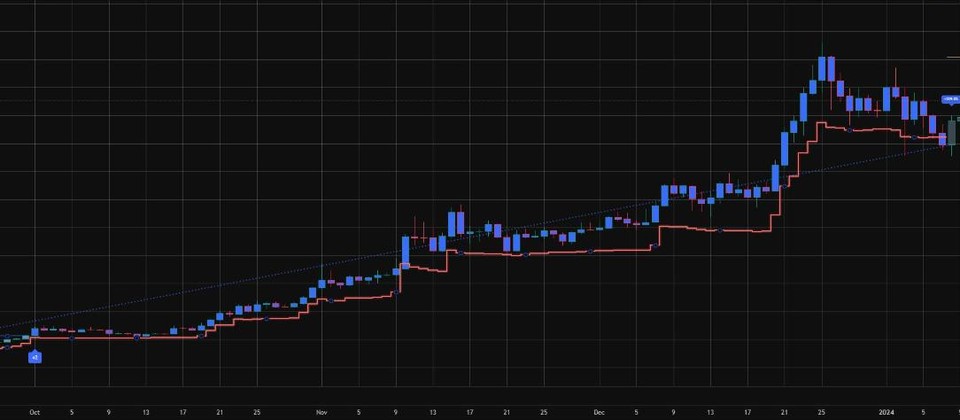
Holding fell as far as −83.4%. Kelly Meter moved to cash on the decline and kept the worst drop to −54.2%.
Product of (1 + position × daily return) × (1 − position change × 0.1%) − 1 (no dividends or taxes)
Download the period dataWatched my account melt in a crash, not knowing when to get out
When the worse of the 1-year and 6-month averages turns negative, it moves to 0% (all cash) and sits the crash out
Lost sleep holding on by gut feel in wild markets
When the last 3 months get shaky it cuts the share and only invests half the Kelly value
Got fooled by indicators that quietly repaint
Daily closes only, never repainted, with 0.1% cost included
No time to work out position sizes every day
An alert fires when the share changes, and the top-right card shows invested and cash at once
If the worse of the 1-year and 6-month average return turns negative, it goes to 0% (all cash).
The bigger the last 3 months' swings, the lower the invested share, and it only ever takes half of the Kelly value.
Calculated daily, but it changes at most weekly and only by 50+ points. No shorts, no leverage, no repaint.
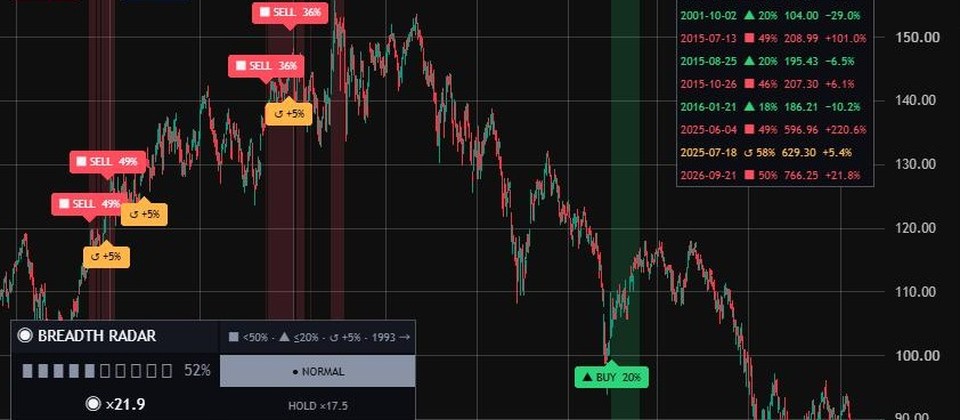
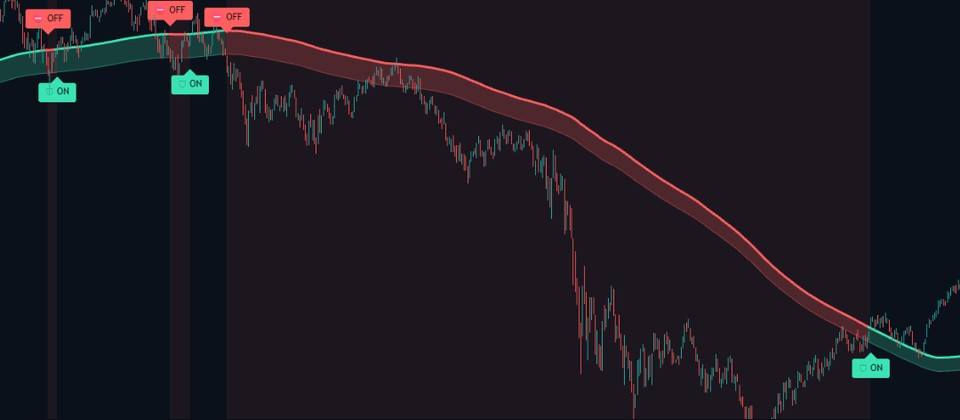
Instead of tangled lines, a background colour and one big number card show today's invested and cash share.
The background turns red at 0% and mint at 100%; every change is stamped on the chart with the cash to hold, like 💵 50%.
Top-right card: invested 100% · cash 0%, and the 2007.10–2009.3 crash: hold −56.5% · Kelly −6.8%.
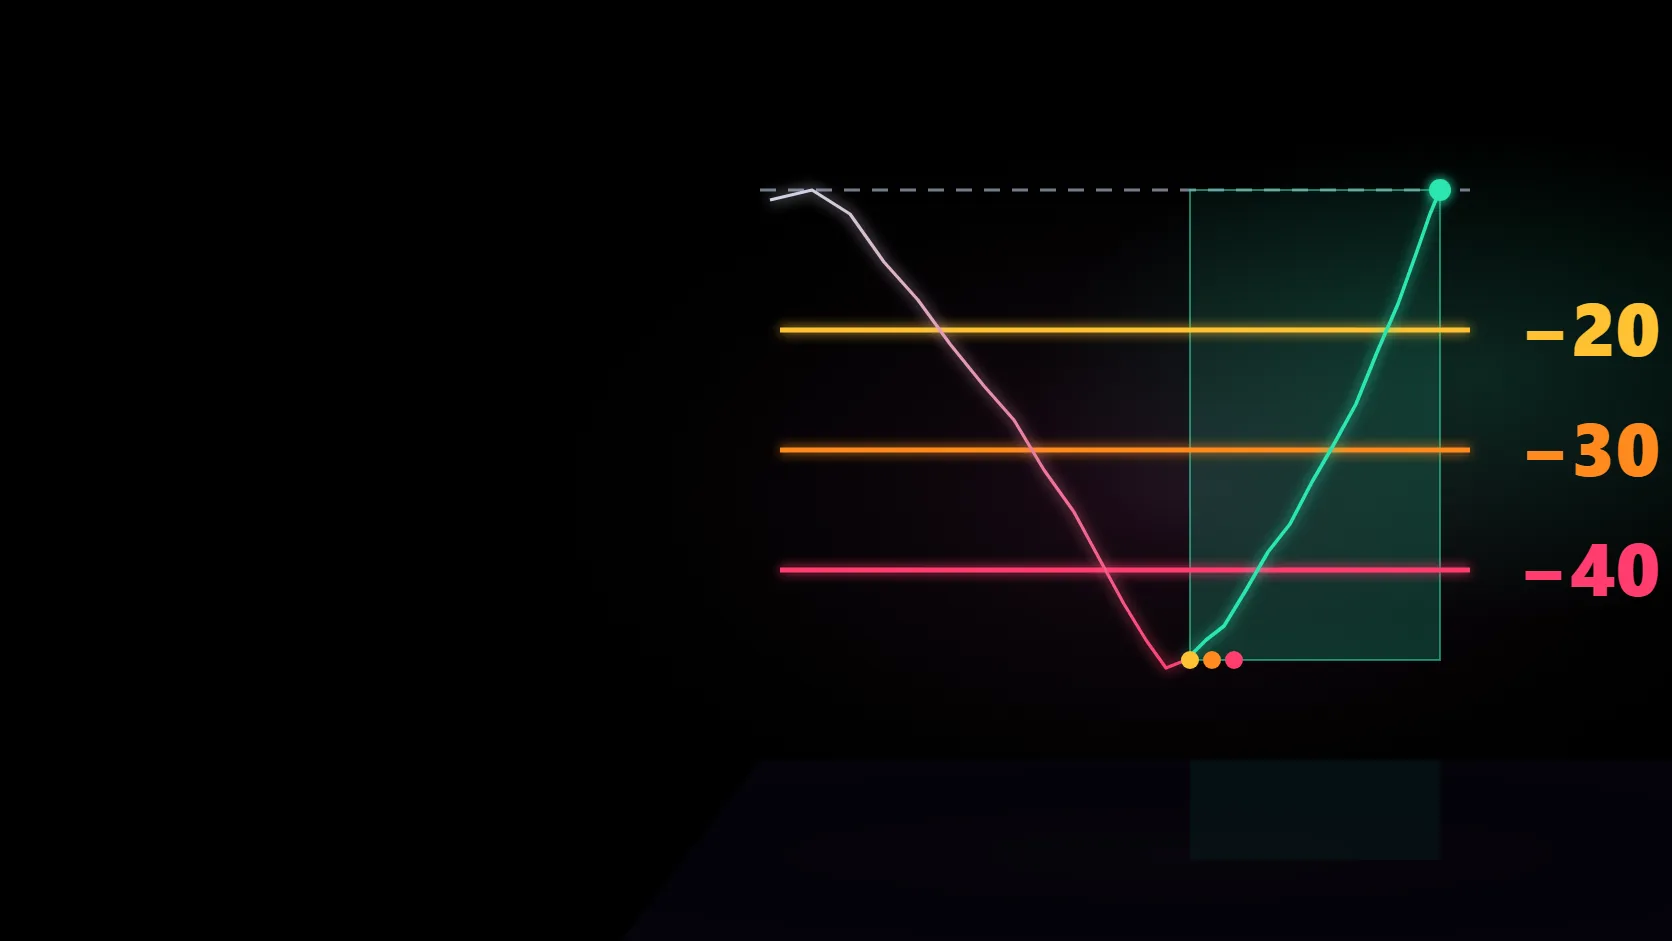
Stocks, an index, crypto and gold: the worst drop when simply holding versus with Kelly Meter.
| Market | From | Hold: worst drop | Kelly Meter: worst drop |
|---|---|---|---|
| S&P 500 (SPY) | 2001 | −56.5% | −26.9% |
| Nasdaq 100 (QQQ) | 2001 | −70.4% | −21.1% |
| Nvidia | 2001 | −89.7% | −69.3% |
| Tesla | 2011 | −73.6% | −54.5% |
| Apple | 2001 | −60.9% | −32.0% |
| Meta | 2013 | −76.7% | −31.9% |
| Bitcoin | 2015 | −83.4% | −59.9% |
| Gold | 2001 | −44.4% | −27.5% |
How Kelly Meter protected the account in the worst crash periods, from real past records (0.1% cost included).
2022 Bitcoin — holding lost −65.3%. Kelly Meter stayed in cash all year.
2008 crisis S&P 500 — holding lost −48.5%. Following the indicator, the loss stopped here.
Dot-com crash 2000.3–2002.10 Intel — holding lost −70.1%. Following the indicator, this much.
You get the full Pine Script v6 source and the 8-language install guide right after payment.
Past performance does not guarantee future results.
ChartArmory built this from Ed Thorp's formula; it is not affiliated with or endorsed by Thorp.
75% of the money goes into that market and the other 25% stays in cash.
No. ChartArmory built it from Thorp's Kelly formula. It is not affiliated with or endorsed by Thorp.
No. It only uses daily closes, so past signals are never repainted, and every position change includes 0.1% cost.
At most weekly and only by 50+ points: about 4 times a year across 65 past markets. No edge: cash the same day.
One payment: full Pine Script v6 source and 30 days of bug support. Personal use and edits are free; resale is not.
You can edit it for personal use. Sharing, redistribution and resale rights are not included.
Put a solid crash shield on your chart with Kelly Meter.
LEADER ROTATION
TOP WARNING
CRASH BUYING
POSITION SIZING
TREND BREAKOUT
VOLATILITY BREAKOUT
LONG-TERM TREND
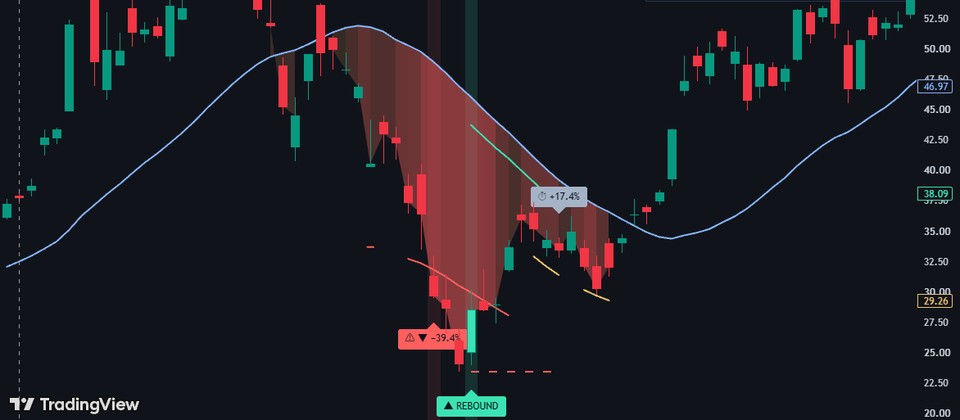
REBOUND OBSERVATION
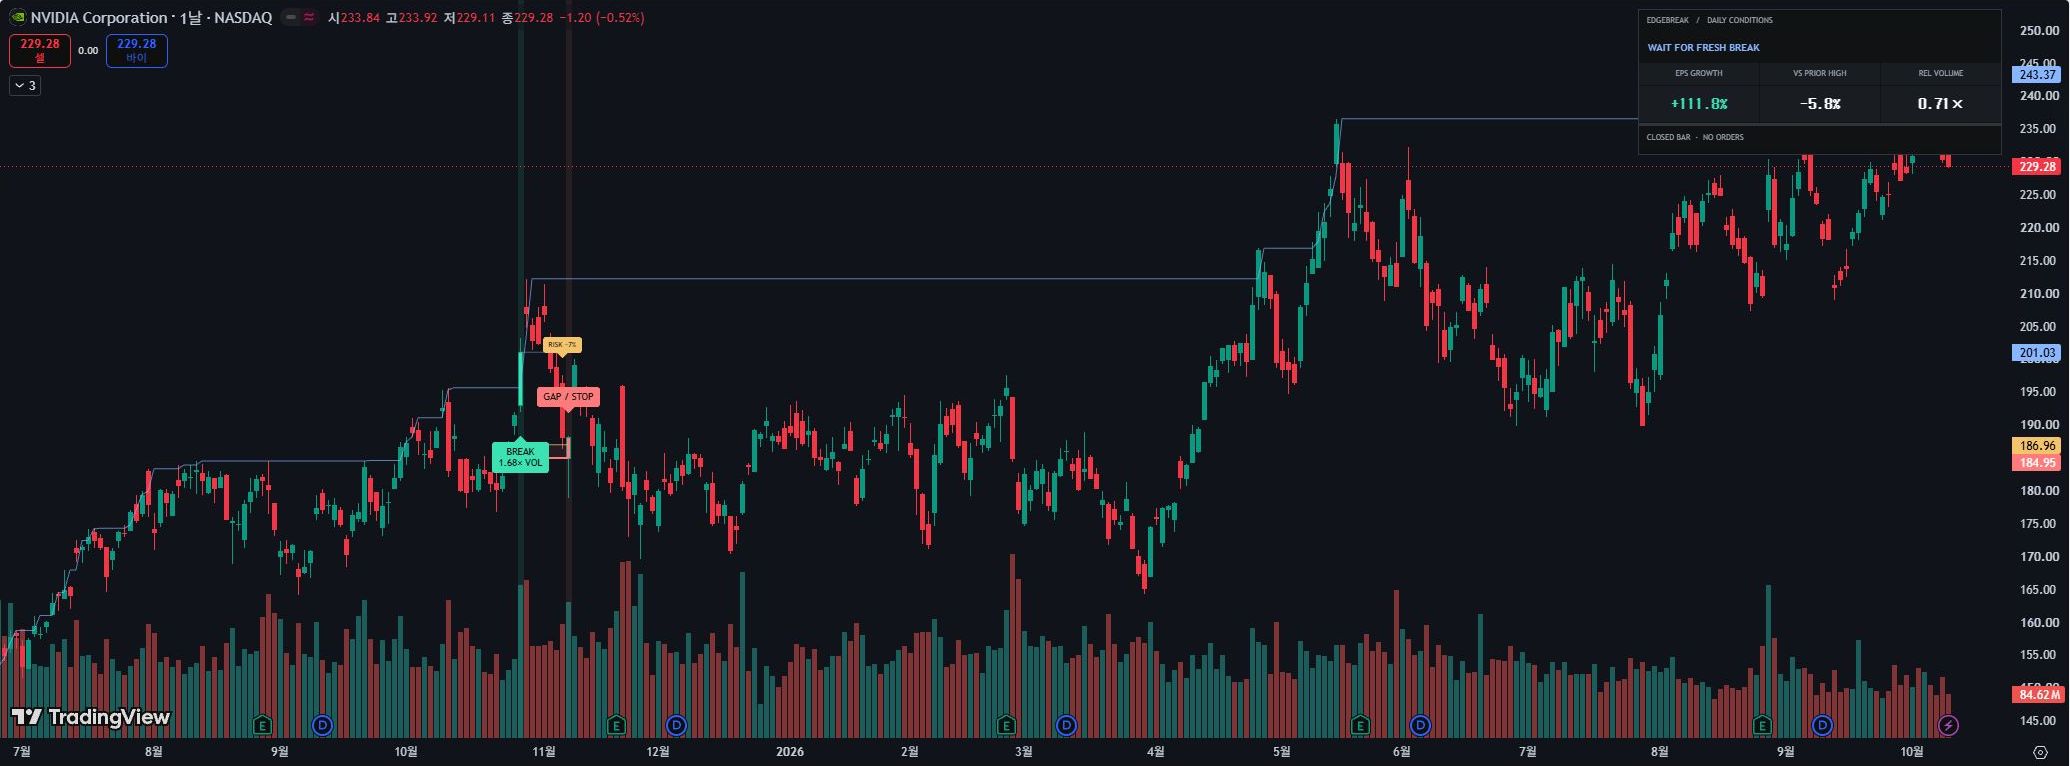
BREAKOUT OBSERVATION
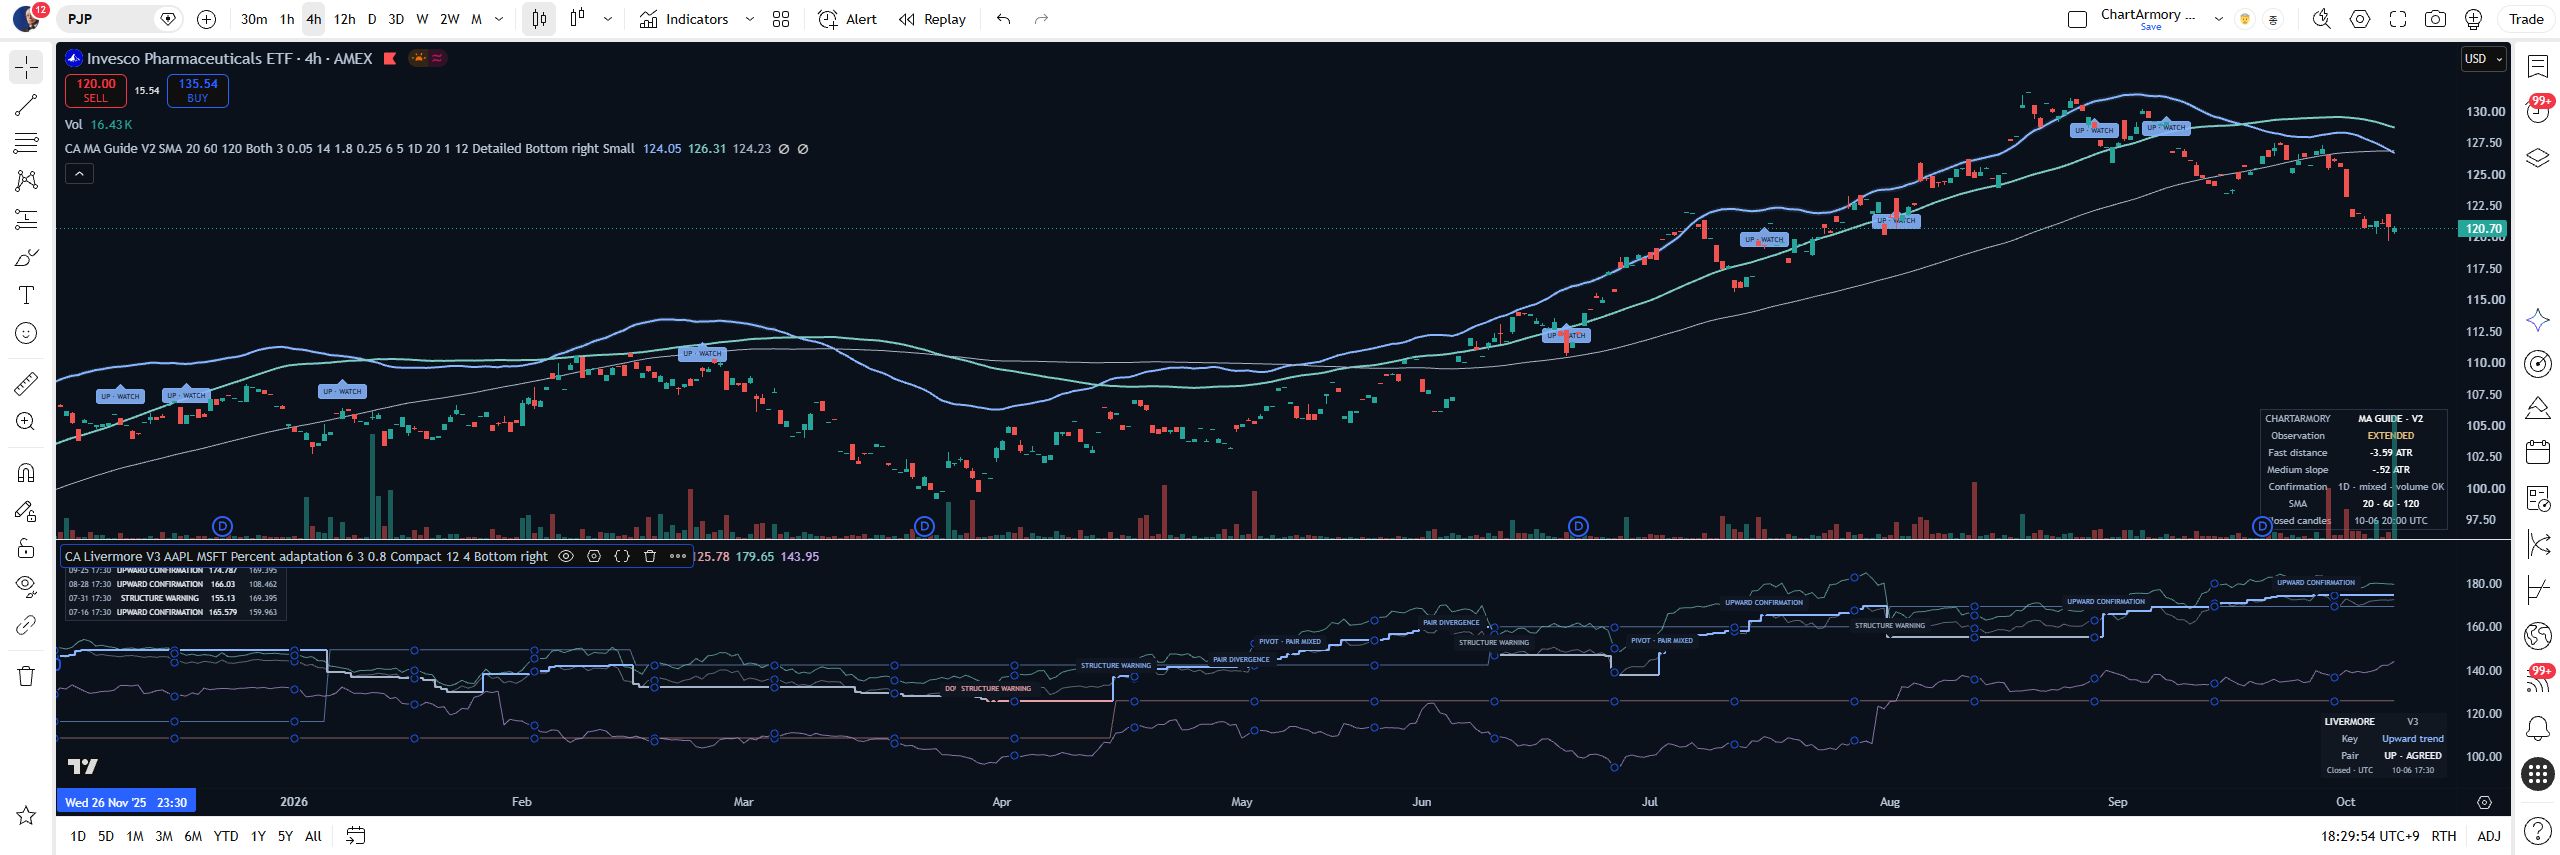
LIVERMORE · V3
TREND OBSERVATION
TradingView