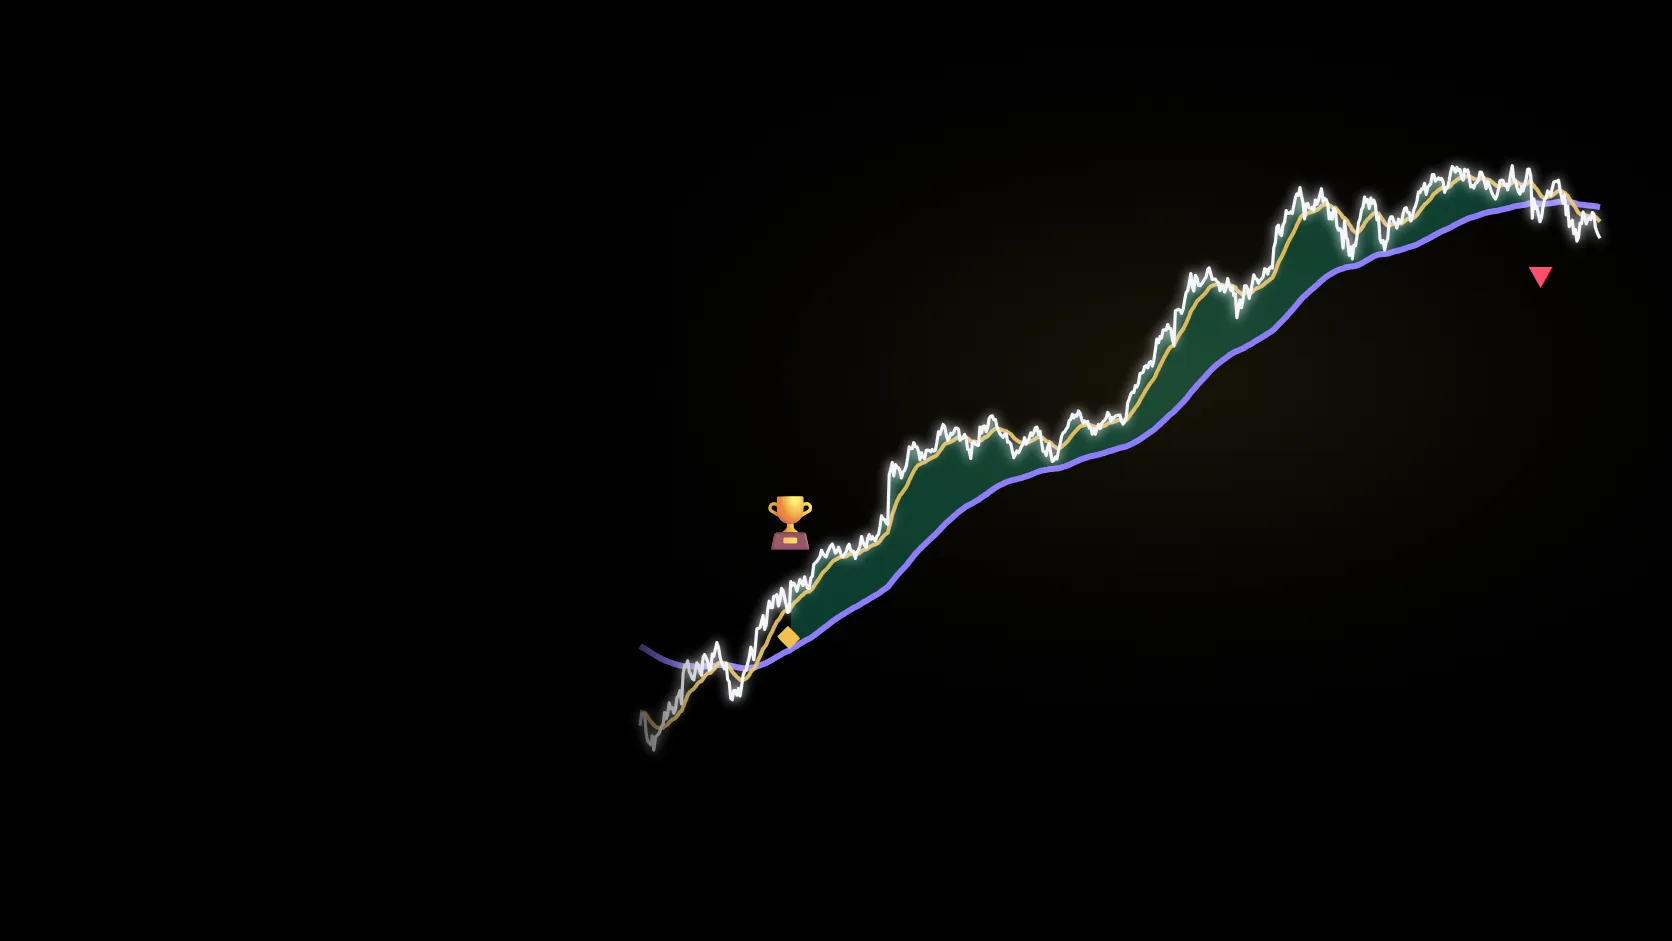
Take off above, land below
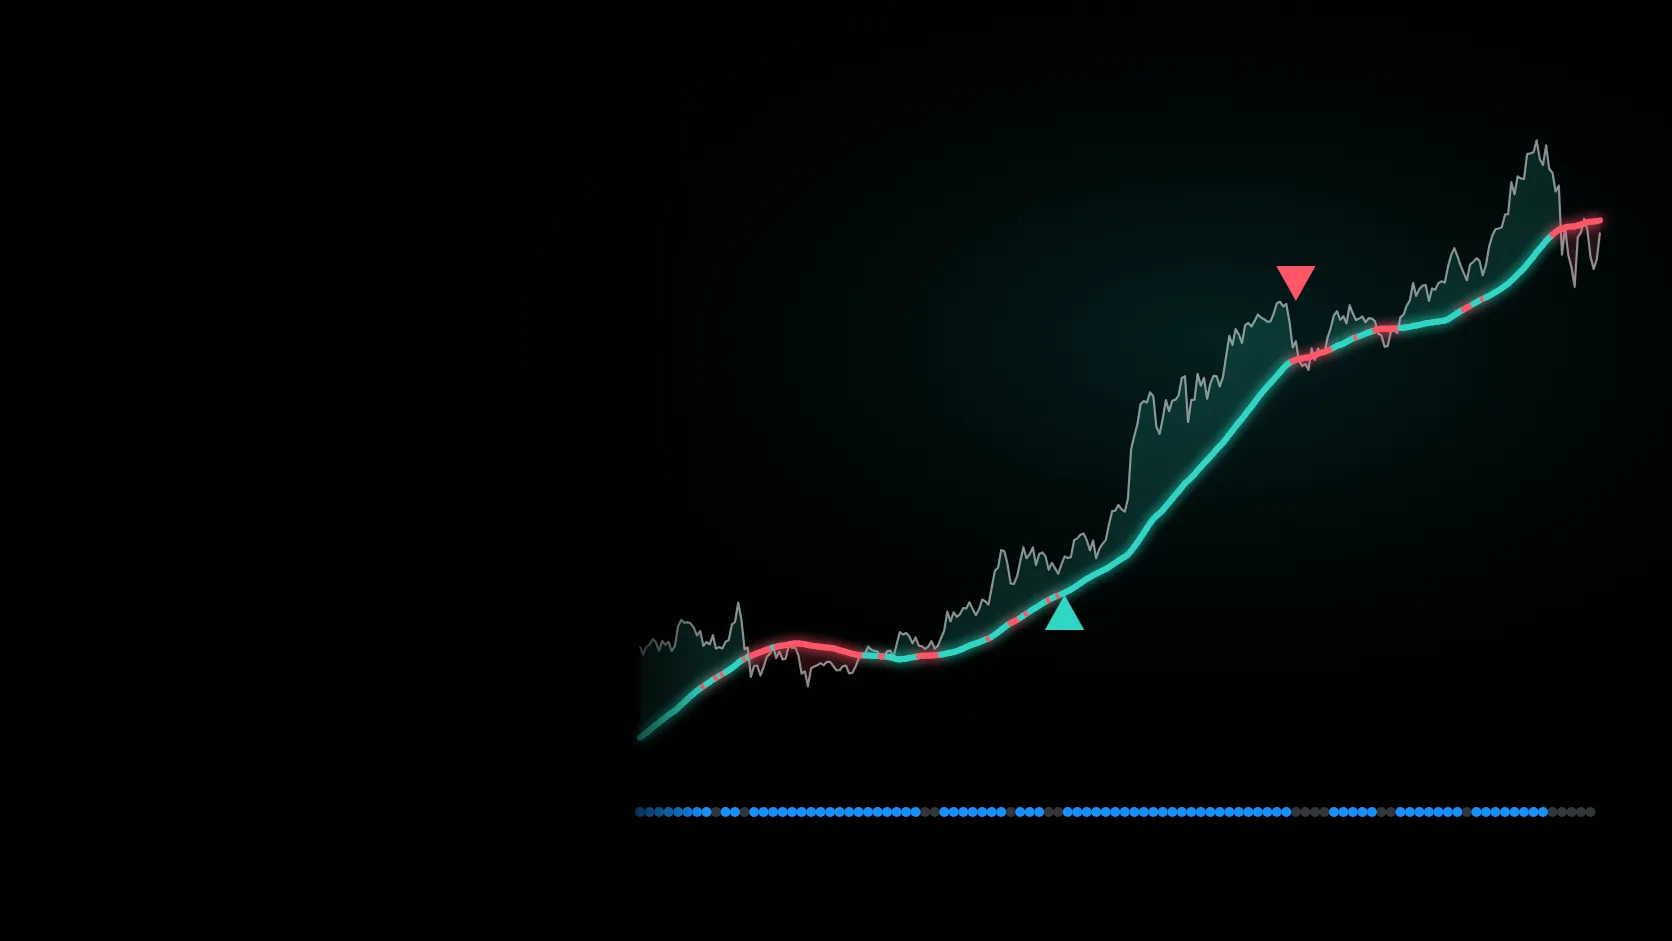
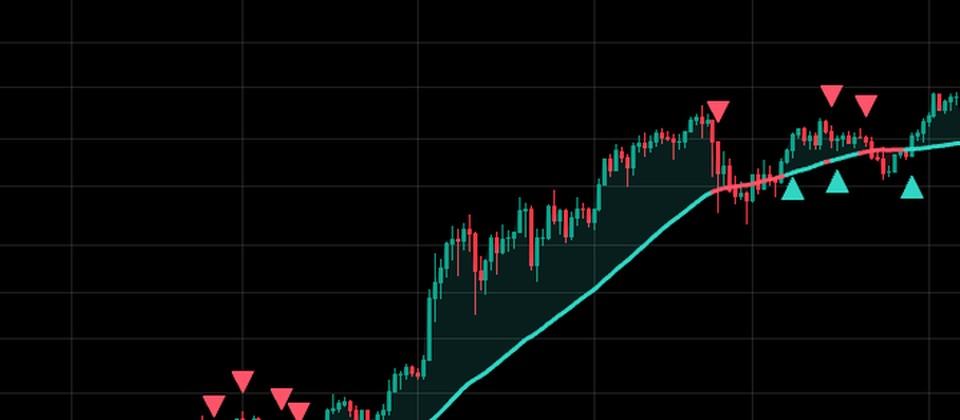
When a day closes above the cloud and above the close 30 days earlier, ✈ buy; when a day closes below the cloud, sell; inside the cloud, keep the current state. Set on the daily close, so it never repaints.
The Ichimoku cloud, built in Japan in 1935 over seven years with the help of 2,000 people, re-tuned by ChartArmory for seven-day crypto markets (10 · 30 · 60).
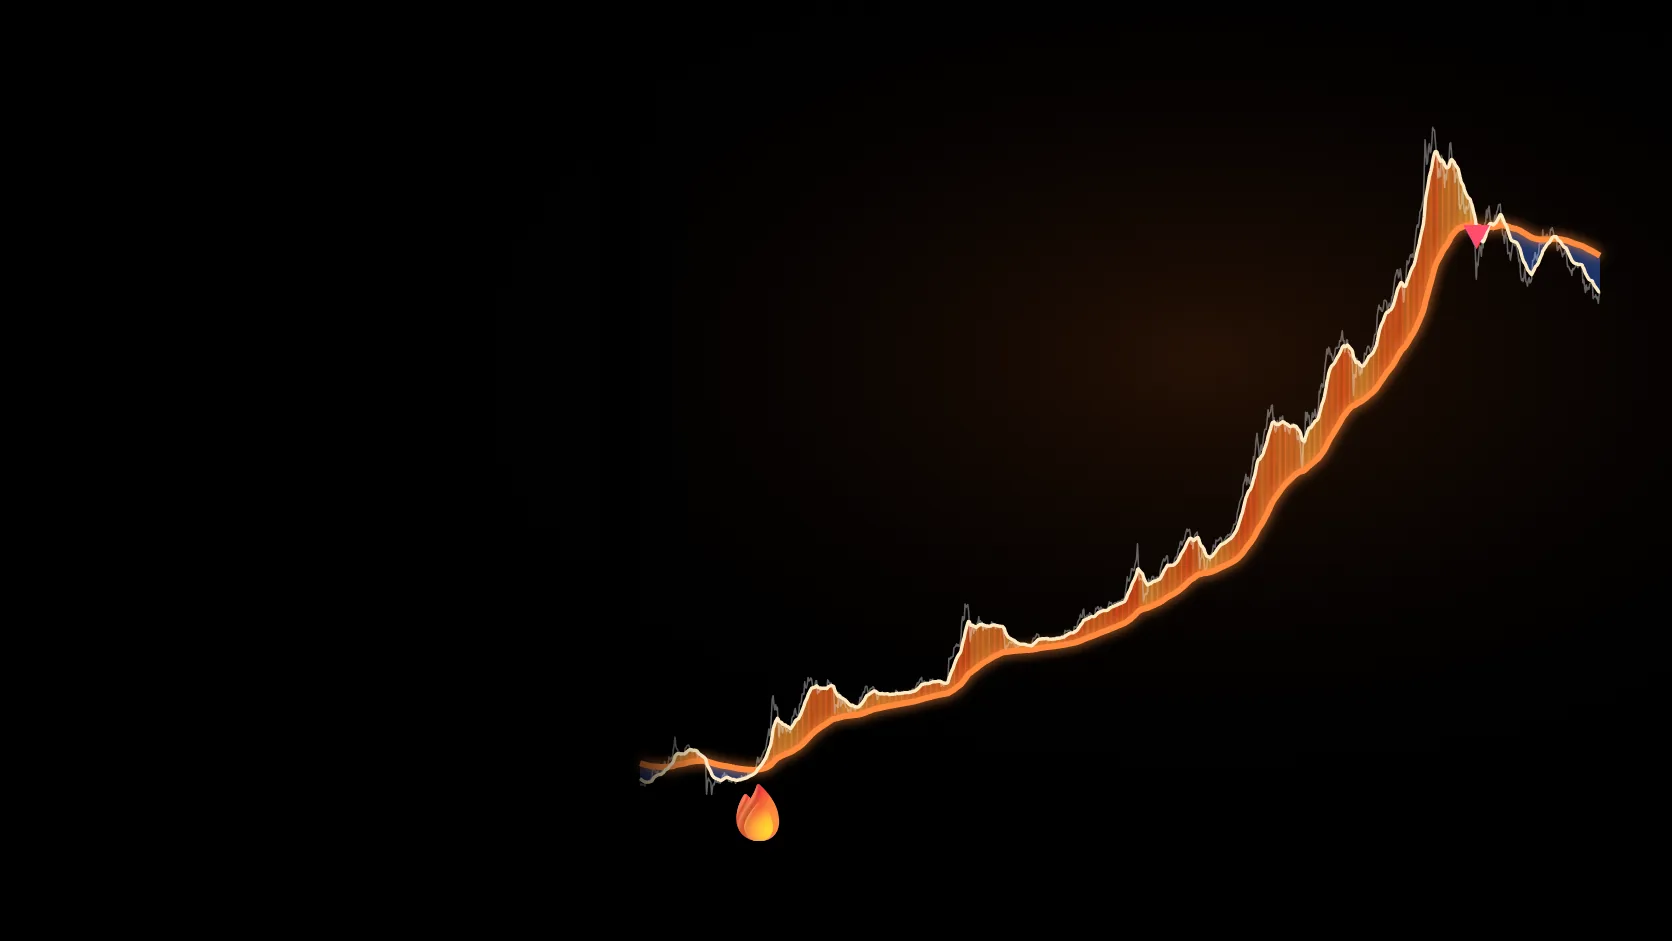
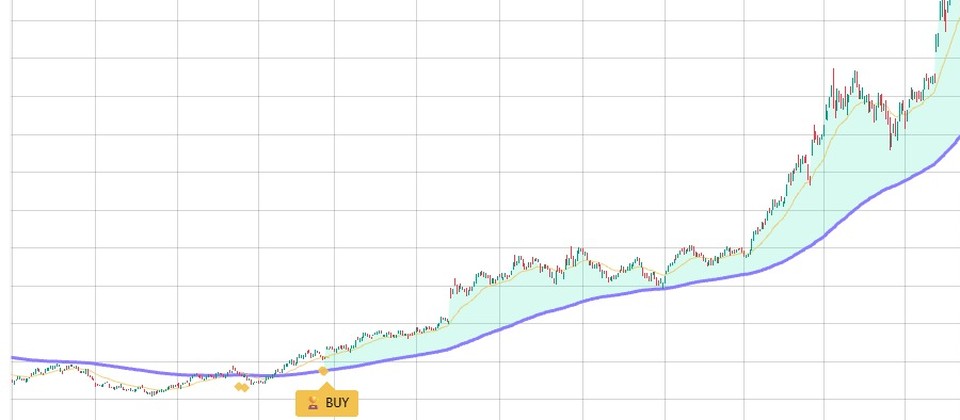
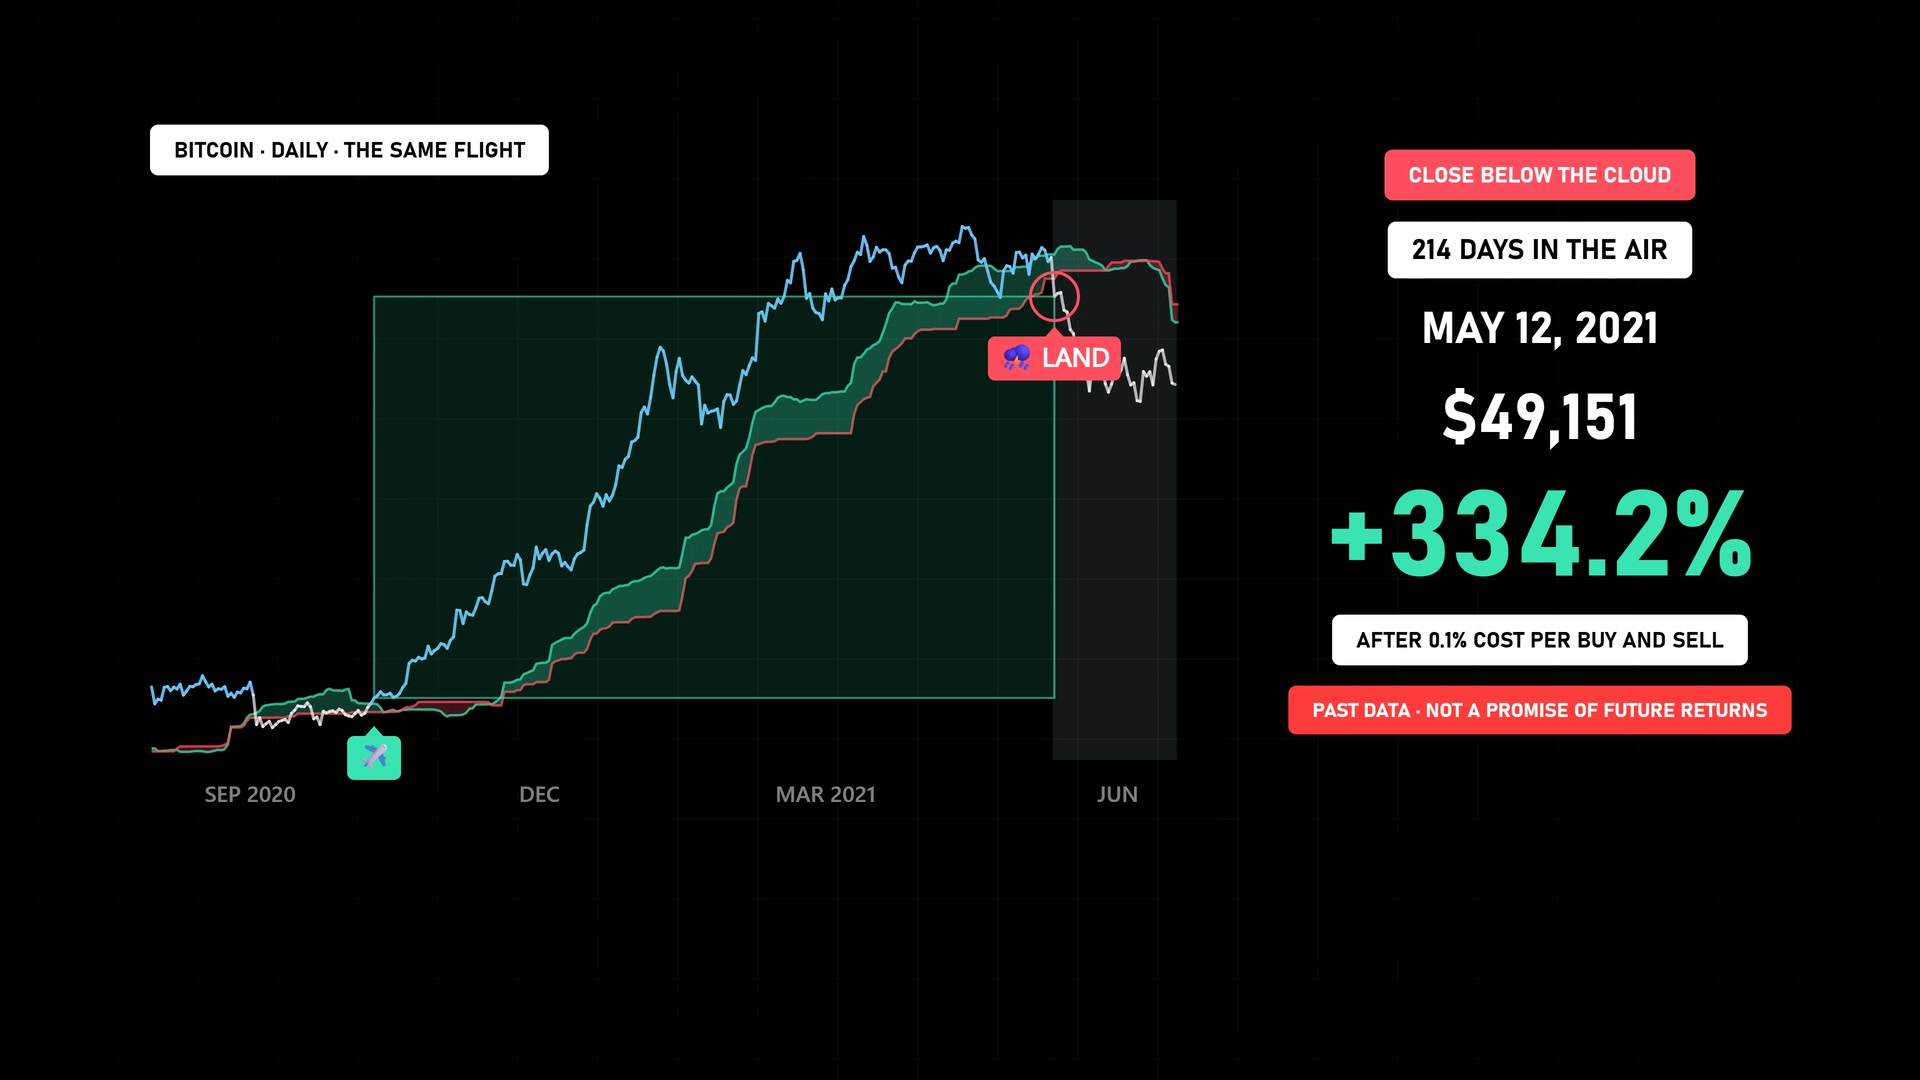
Bought on the day it closed above the cloud, sold on the day it closed below. Held for 214 days while the cloud held it up.
On 10 October 2020 the take-off signal was confirmed at the close of $11,296.36. 214 days later, on 12 May 2021, the close fell below the cloud and it landed at $49,150.54. Within 70 days Bitcoin dropped to $29,807.
Signal and fill at that day's close, 0.1% cost per buy and sell · a replay of the same rule as the TradingView indicator (Yahoo BTC-USD daily closes; may differ slightly from exchange charts)
Download the calculation record (JSON) ↓Drag the handle to compare the chart with and without Cloud Pilot.
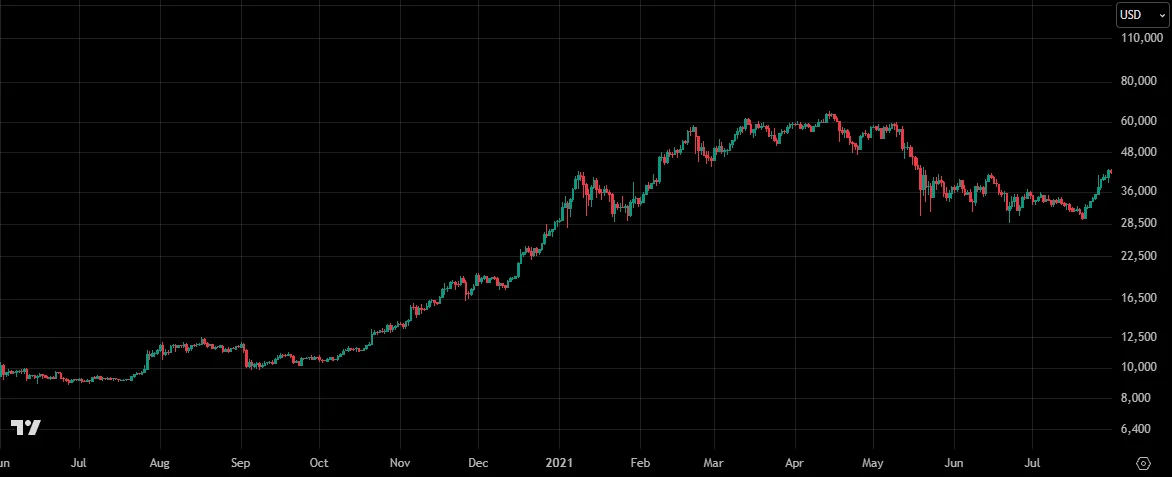
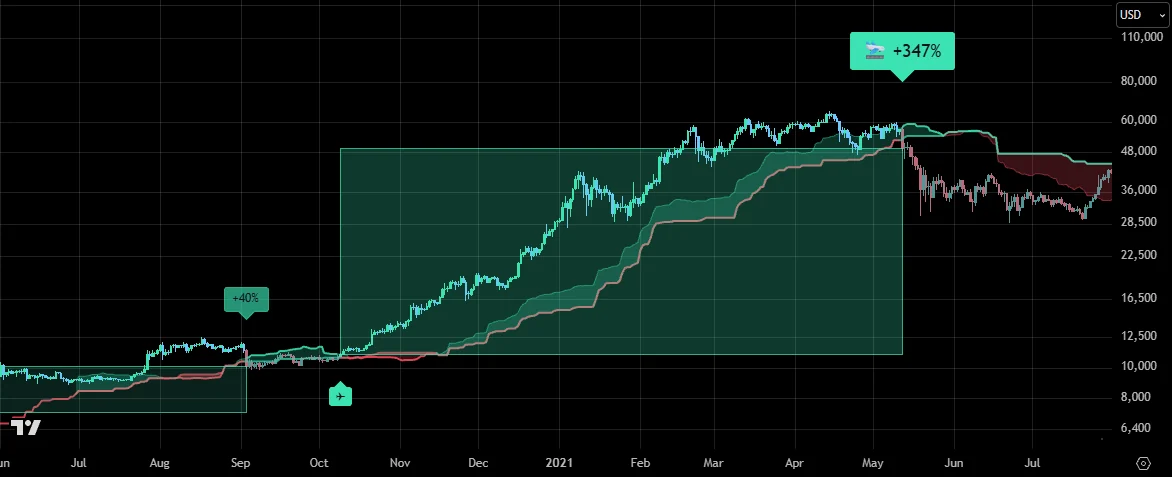
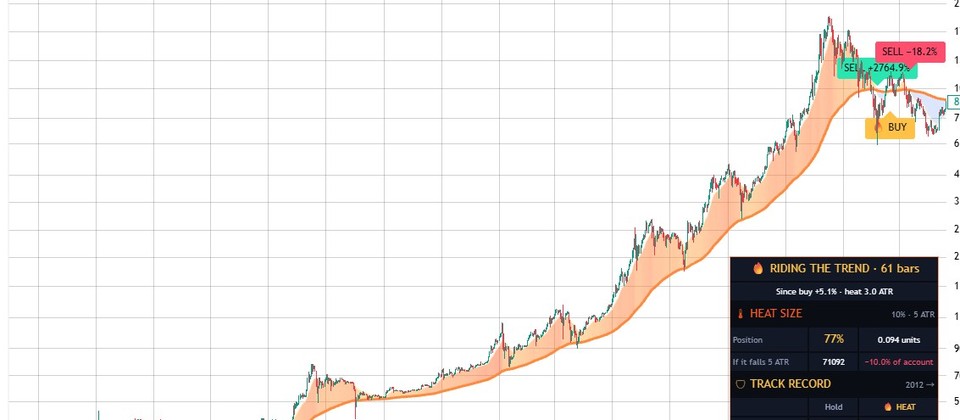
Calculated from historical data. Future returns are not guaranteed.BTCUSD · 1D · 2020.06–2021.07Chart: TradingView
ProblemYou don't know where to sell, so the gains slip away
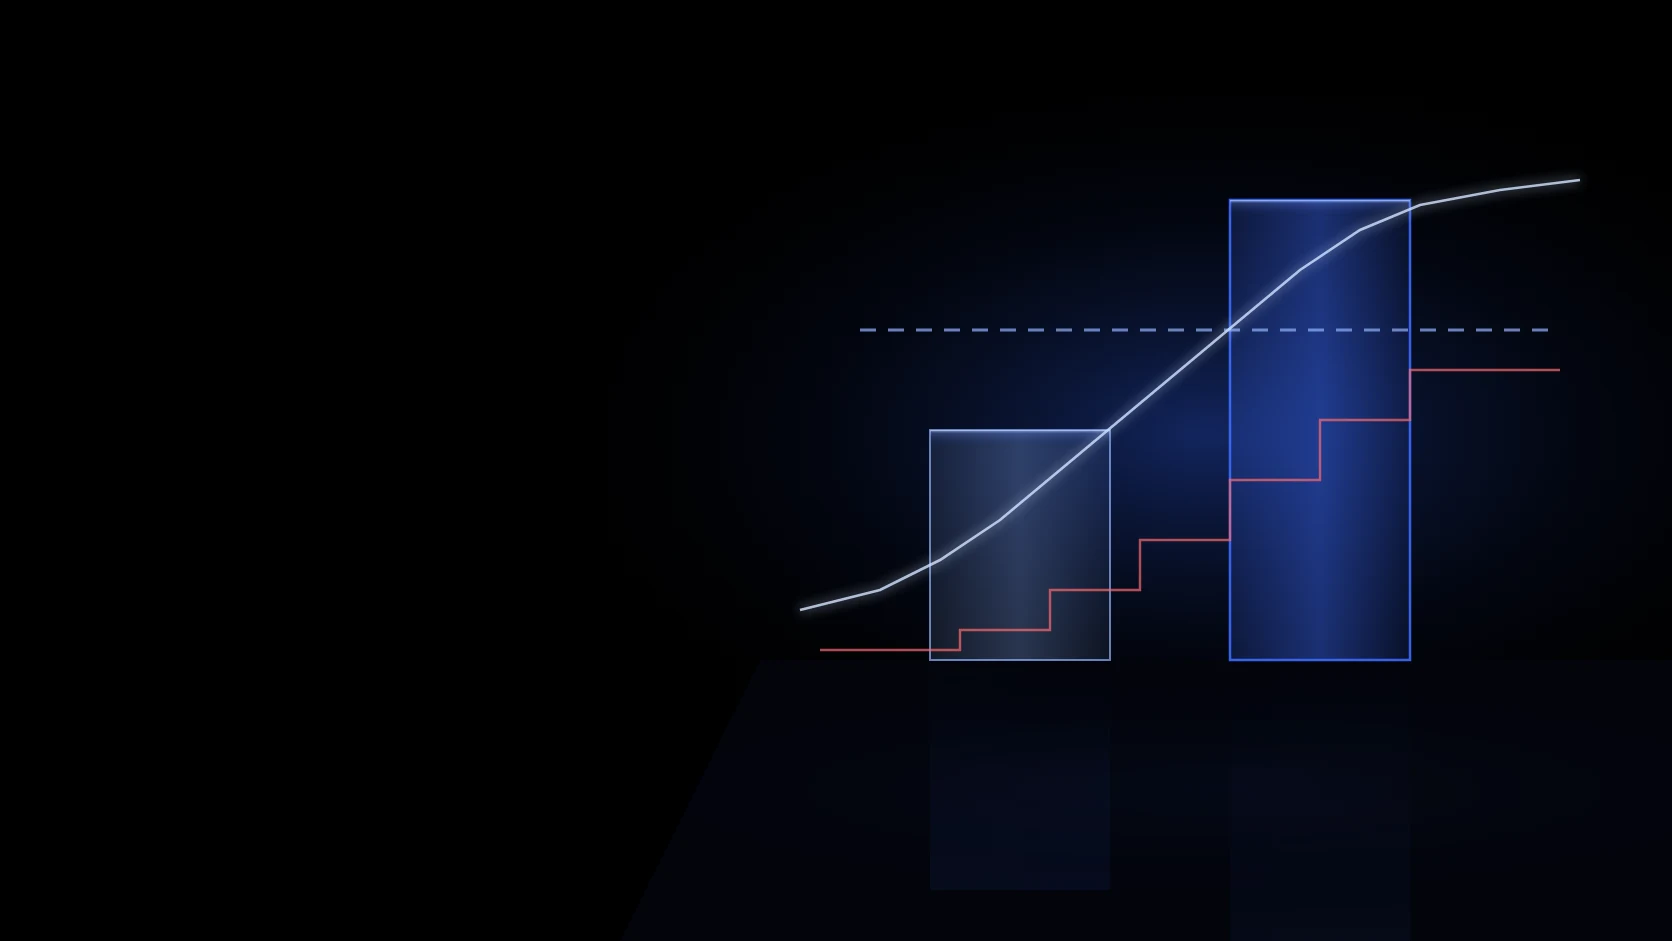
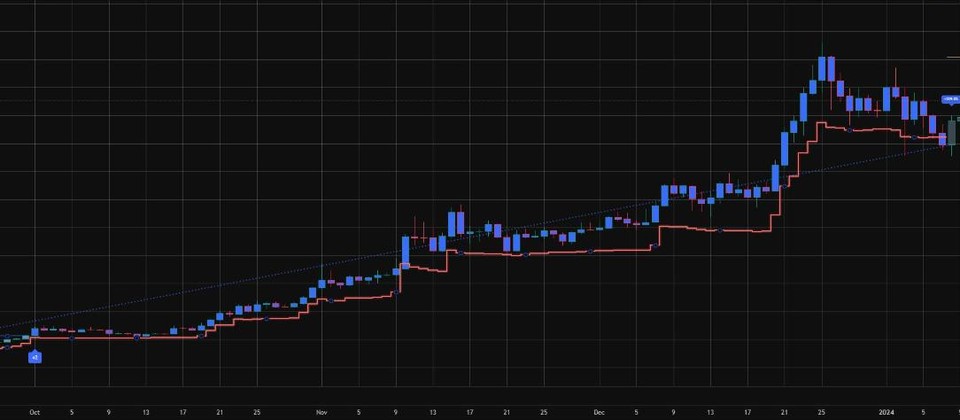
FixThe bottom of the cloud is the sell line. The panel shows its price for the next 30 days in advance
ProblemIntraday swings make you chase prices
FixSignals come only from the finished daily close, and buy and sell alerts tell you the day
ProblemYou're unsure whether six-day-week settings fit 24/7 crypto
FixThe default is a 10 · 30 · 60 cloud tuned for seven-day crypto markets
When a day closes above the cloud and above the close 30 days earlier, ✈ buy; when a day closes below the cloud, sell; inside the cloud, keep the current state. Set on the daily close, so it never repaints.
The cloud is drawn 30 days ahead. The panel splits the next 30 days into five 6-day tiles, each with the weather (☀ rising cloud / ⛈ falling cloud) and that day's sell-line price.
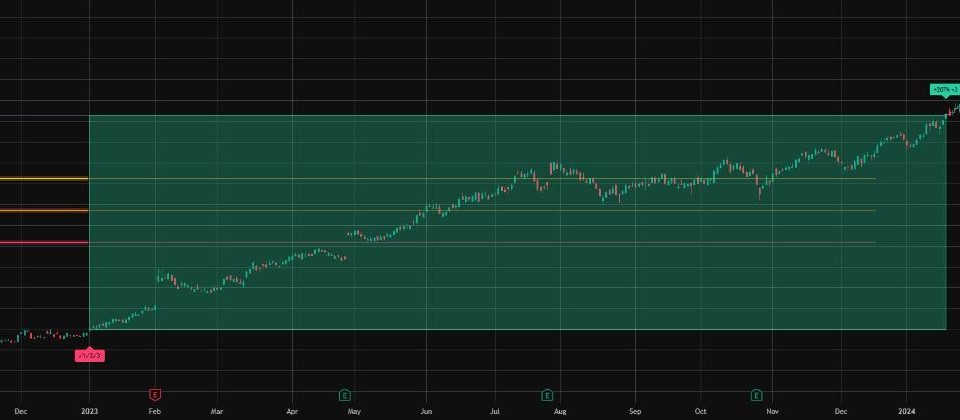
Mint and sky-blue candles while you hold, grey while in cash. At each sell a box covers the whole trade, and wins are marked with a mint box and a big number. Alerts for buy and sell.
Bitcoin or cash only, no leverage, recorded to 24 October 2026.
| Start | Just holding | Cloud Pilot | Worst drop (hold → pilot) |
|---|---|---|---|
| 2015 | $256,000256× | $469,480469× | −83.4%−68.5%▲14.9%pavoided |
| 2018 | $5,8905.9× | $20,16020.2× | −81.5%−65.0%▲16.5%pavoided |
| 2020 | $11,17011.2× | $20,98021.0× | −76.6%−33.2%▲43.4%pavoided |
| 2022 | $1,6901.7× | $3,4403.4× | −66.9%−30.9%▲36.0%pavoided |
| 2024 | $1,8201.8× | $2,2002.2× | −53.1%−30.9%▲22.2%pavoided |
Big Bitcoin declines, just holding vs the Cloud Pilot rule (0.1% cost per trade).
With the indicator −33.2%
2021.11–2022.11 bear market — holding −76.6%. The rule had sold below the cloud and was in cash.
With the indicator −14.9%
2025.10–2026.6 decline — holding −53.1%. It got off below the cloud and waited in cash.
With the indicator −20.7%
2020.2–3 COVID crash — holding −51.3%.
No monthly fee: one payment and the full Pine Script v6 source is yours to keep and edit.
Past performance does not guarantee future results.
Built independently by ChartArmory from the public Ichimoku Kinko Hyo idea; not affiliated with or endorsed by the Hosoda family or Keizai Hendo Soken.
A signal on a closed bar never changes; only today’s unfinished bar can move.
Other symbols and higher timeframes use only data available at that moment, so no future values leak into past signals.
Past examples are calculated after trading costs (0.1% per side), and you can download the raw data as JSON.
The exact names you see in TradingView’s settings (Inputs tab).8 languages supported
Open the daily crypto chart and check the candle colour (mint/sky = holding, grey = cash) and where price sits against the cloud.
In the panel at top right, see the distance to the sell line and the cloud weather for the next 30 days.
Most days you just look and move on; buy or sell only on the day a close above or below the cloud is confirmed.
Hiring a developer usually costs $2,000–$5,000+ and weeks of building and testing. Here, one payment gets you tested Pine Script v6 source right away, yours to keep.
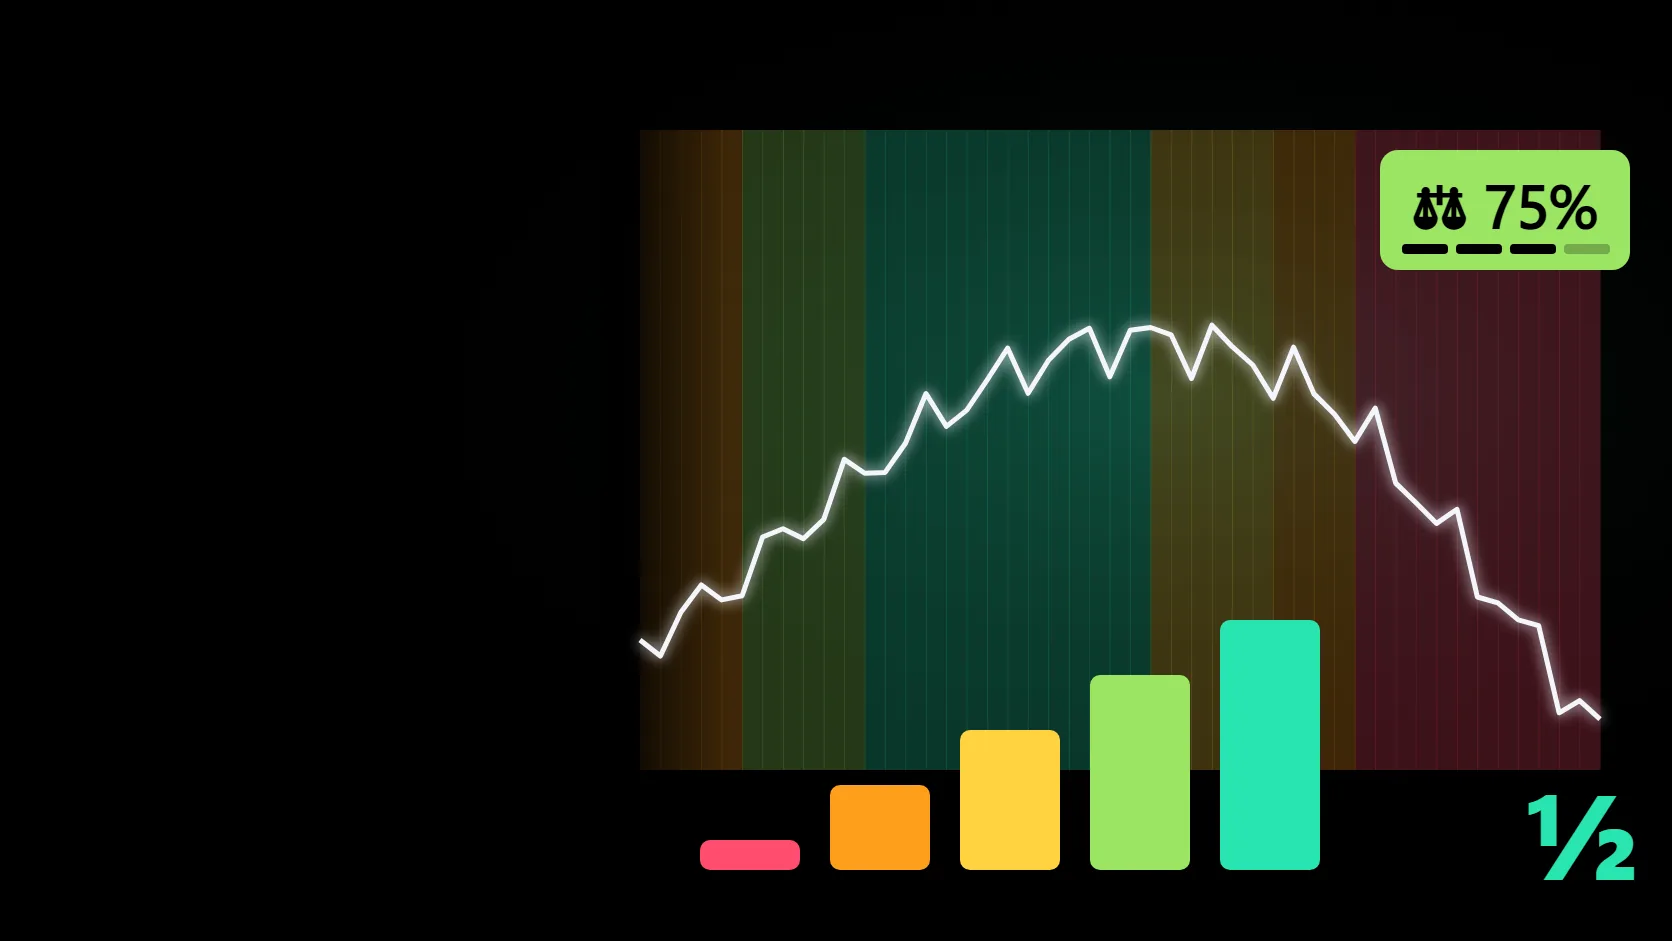
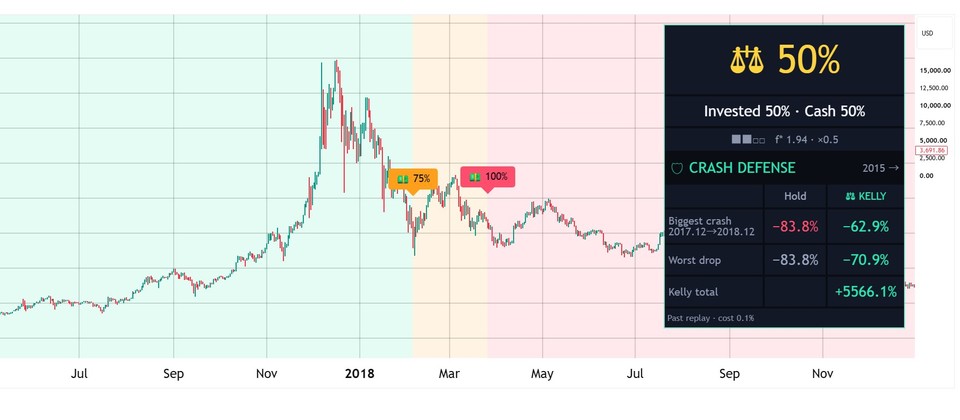
Let Cloud Pilot decide when to hold and when to wait in cash, and Kelly Meter how much to put in.
View indicatorEach indicator is sold separately; combined results have not been tested.
A charting method made by Goichi Hosoda (pen name Ichimoku Sanjin), head of the markets desk at the Miyako Shimbun, over seven years with the help of 2,000 people (published as a book in 1969). The 'cloud' is a band of mid-prices pushed forward in time.
The original settings date from a six-day trading week. Crypto trades seven days a week, so daily crypto charts use 10 · 30 · 60.
About half of the trades win (15 of 31). In sideways markets small losses (−9% on average) come several times, and one big trend (wins average +84%) makes up for them.
No. They appear after the daily close is final and never repaint. The indicator places no orders.
You can add it to any daily chart, but the rule is tuned for coins such as Bitcoin and Ethereum. Results on stocks can be very different.
You can edit it for personal use. Sharing, redistribution and resale rights are not included.
Put the full source code of Cloud Pilot, which shows the sell line 30 days ahead, on your TradingView chart now.
Crypto trend tool
Bitcoin cycle tool
TREND + HEAT SIZING
Breakout step checker
PULLBACK TREND
POSITION SIZER
LEADER ROTATION
TOP WARNING
CRASH BUYING
POSITION SIZING
TREND BREAKOUT
VOLATILITY BREAKOUT
LONG-TERM TREND
REBOUND OBSERVATION
BREAKOUT OBSERVATION
LIVERMORE · V3
TREND OBSERVATION
TradingView