Skip to news
CHARTARMORY JOURNAL

News&Tools

Federal Reserve Board releases results of the 2025 Survey of Consumer Finances, which provides the public and policymakers with detailed insights into the economic condition of American families

Read original
Economy

Latest updates49 stories

Economic calendar

Checking the schedule.

    Checking the schedule.

    Sources and collection status

    Coverage: US CPI, PPI, employment releases and FOMC, official earnings schedules from ASML, SAP and ASM, plus EIA’s published weekly petroleum report and the next Short-Term Energy Outlook. Not all countries, companies or energy releases are covered.

    Schedules can change. Meetings and events without a published time retain their local dates. Consensus estimates and actual release values are not provided.

      ChartArmory Assist

      Join Telegram ↗

      ChartArmory Free Indicators

      MA GUIDEFree

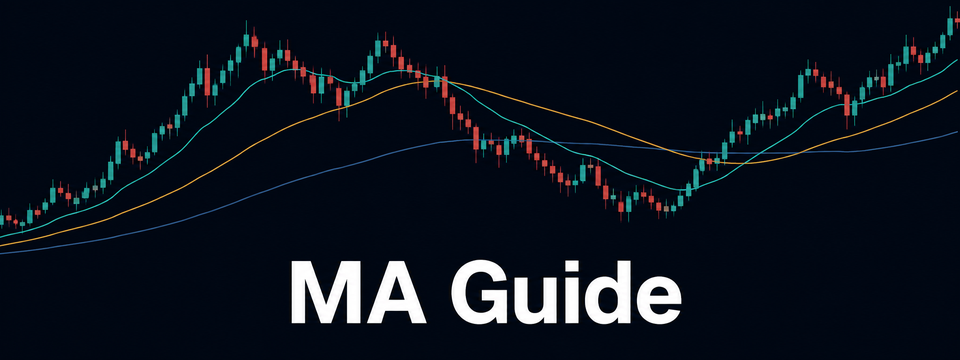
      ChartArmory MA Guide

      Read moving-average direction and distance, from pullback watch to recovery confirmation.

      Jesse Livermore, Financial World photograph from 1923

      Jesse Livermore · Market KeyFree

      Livermore Market Key V2

      Compare two instruments and their combined price record to see whether their trends agree or diverge.

      CHARTARMORY STUDIO

      Indicators that fit your approach

      Ready-to-use indicators with full source code

      Investment lab

      Investment return calculator

      Calculated result1,180Gain / loss
      Contributed capital
      10,000
      Return
      11.8%
      The shared URL includes your amounts and assumptions. Do not enter personal information.

      The rate is an assumption, not a forecast or guaranteed return. A lower average cost does not necessarily reduce loss risk. Method ↗

      Market dashboard

      Connecting to TradingView…

      TradingView data. Stocks and other exchange data may be delayed. Check the quote time and delay status inside each widget; this page does not verify quote freshness.

      BTC / USD

      BITSTAMP:BTCUSD

      Connecting to TradingView…

      UTC — These are market charts, not EdgeTrend BUY/SELL signals or investment recommendations.

      External widgets connect to TradingView. TradingView ↗

      Crypto sentiment index

      Loading the sentiment index...

      Reading room

      Chart reference

      RSI

      RSI: relative strength index

      RSI compares recent gains and losses to express price momentum on a 0–100 scale. It does not value a business or forecast returns.

      MACD

      MACD: trend and momentum

      MACD examines momentum through the difference between fast and slow moving averages. A common setting is 12, 26, 9; settings can vary.

      MA

      Moving averages: SMA and EMA

      Moving averages smooth a window of prices. SMA gives observations equal weight; EMA places more weight on recent observations.

      ATR

      ATR: average true range

      ATR smooths price ranges that account for gaps. It measures the size of movement, not its direction or a buy/sell decision.

      Investing glossary

      Compound interestCompound interest
      Growth earned on principal and on previously accumulated interest or reinvested returns.
      ReturnReturn
      Gain or loss relative to the amount invested, usually expressed as a percentage. The period and treatment of costs matter.
      Average costAverage cost
      Total acquisition cost divided by total quantity. Unequal quantities make it different from a simple average of purchase prices.

      Test your understanding

      Educational only. This does not assess professional competence, risk capacity or financial-product suitability.

      0 / 5
      01Does RSI at 80 mean an immediate fall?

      Answers are evaluated on this page. A shared link includes your selected answers.

      Daily market briefing