Finds the pullback
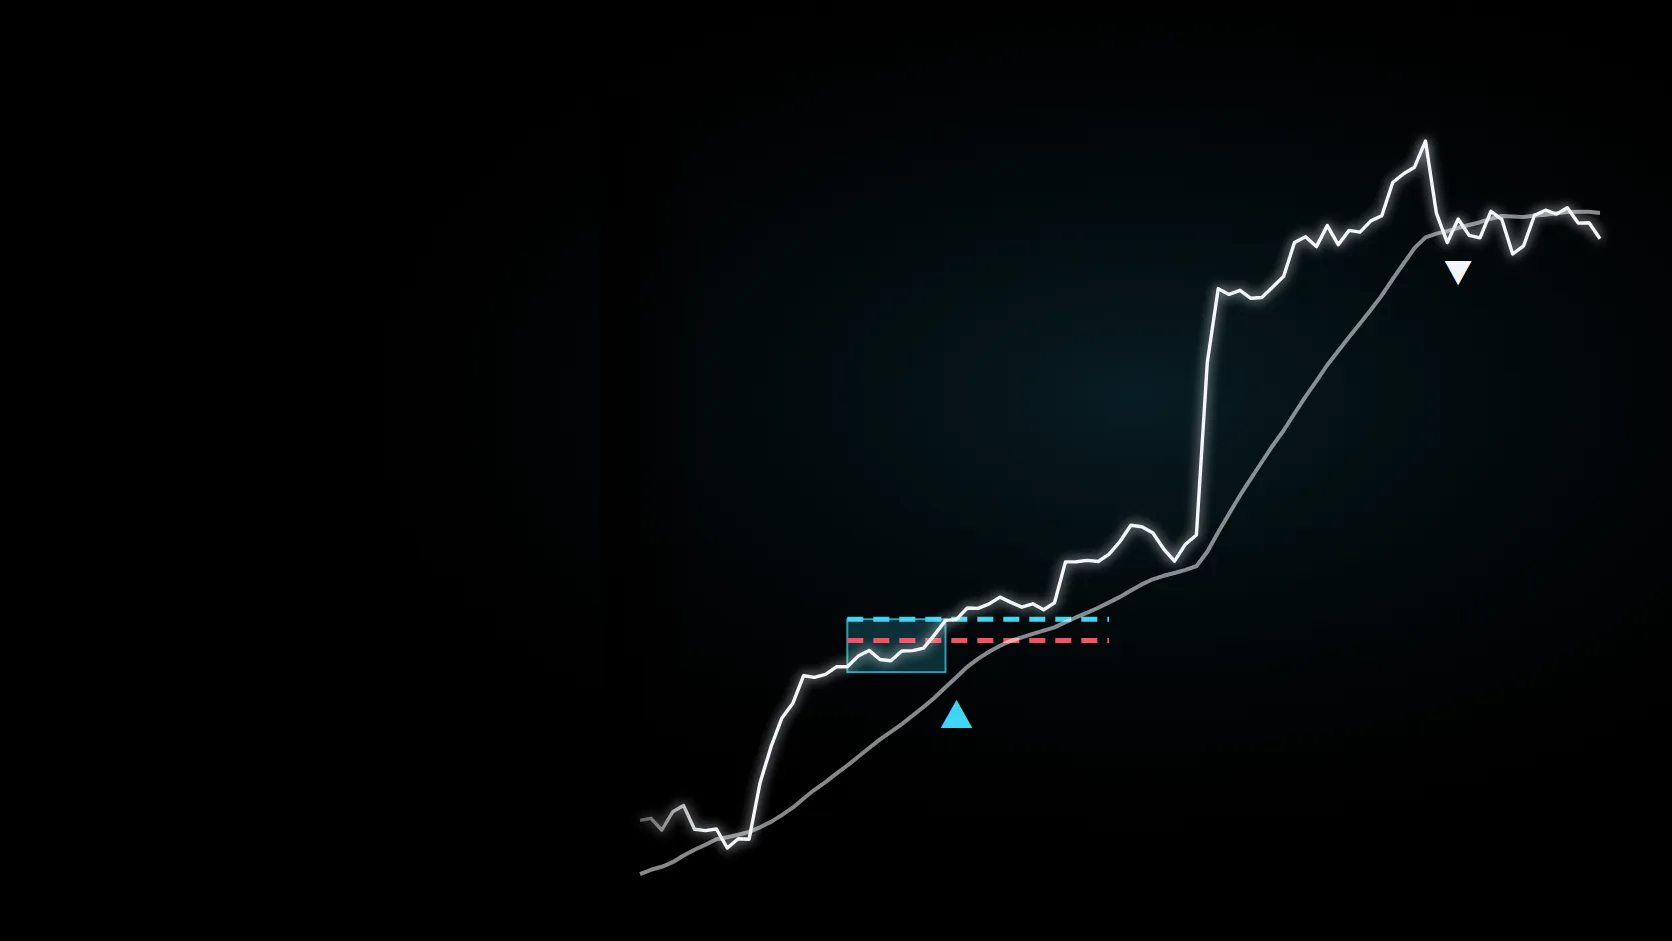
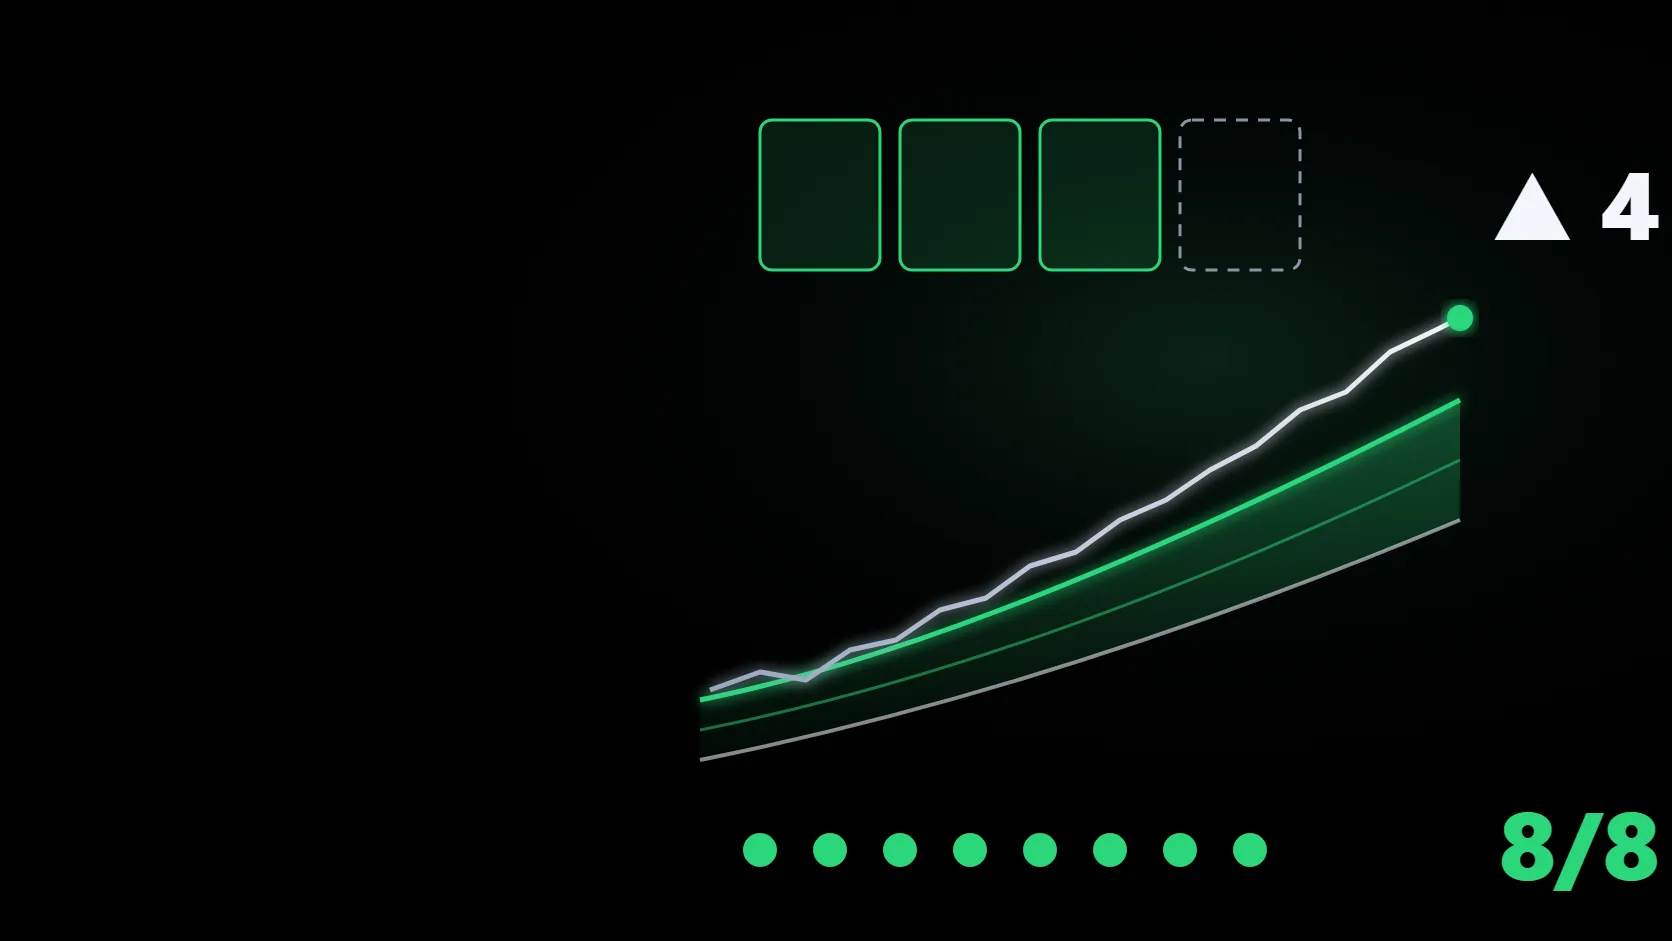
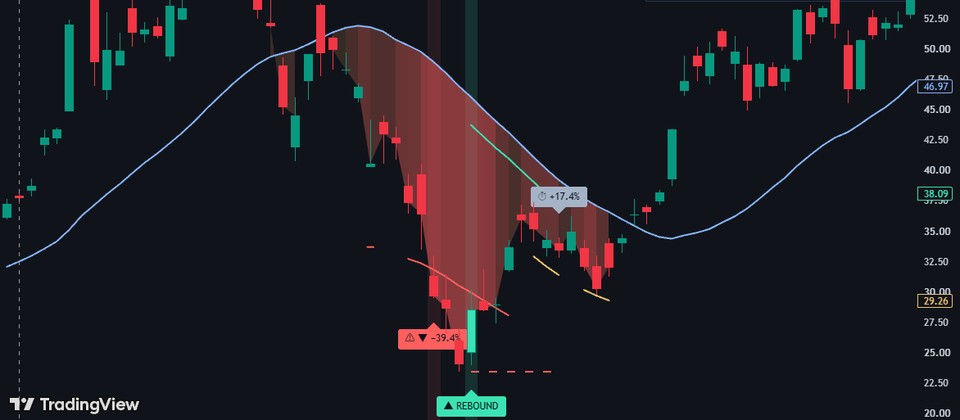
In a strong uptrend (ADX above 20, +DI > −DI, above the 150-day line) a low touching the 20-day line marks ◆; a close above that candle's high within 3 days gives 🏆 BUY.
Inspired by 45-year trader Linda Raschke's 'Holy Grail' setup, rebuilt by ChartArmory to ride big uptrends instead of quick trades.
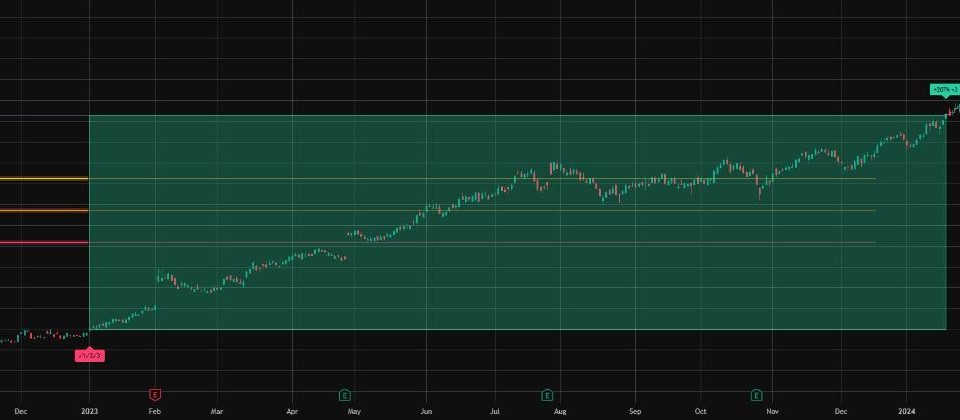
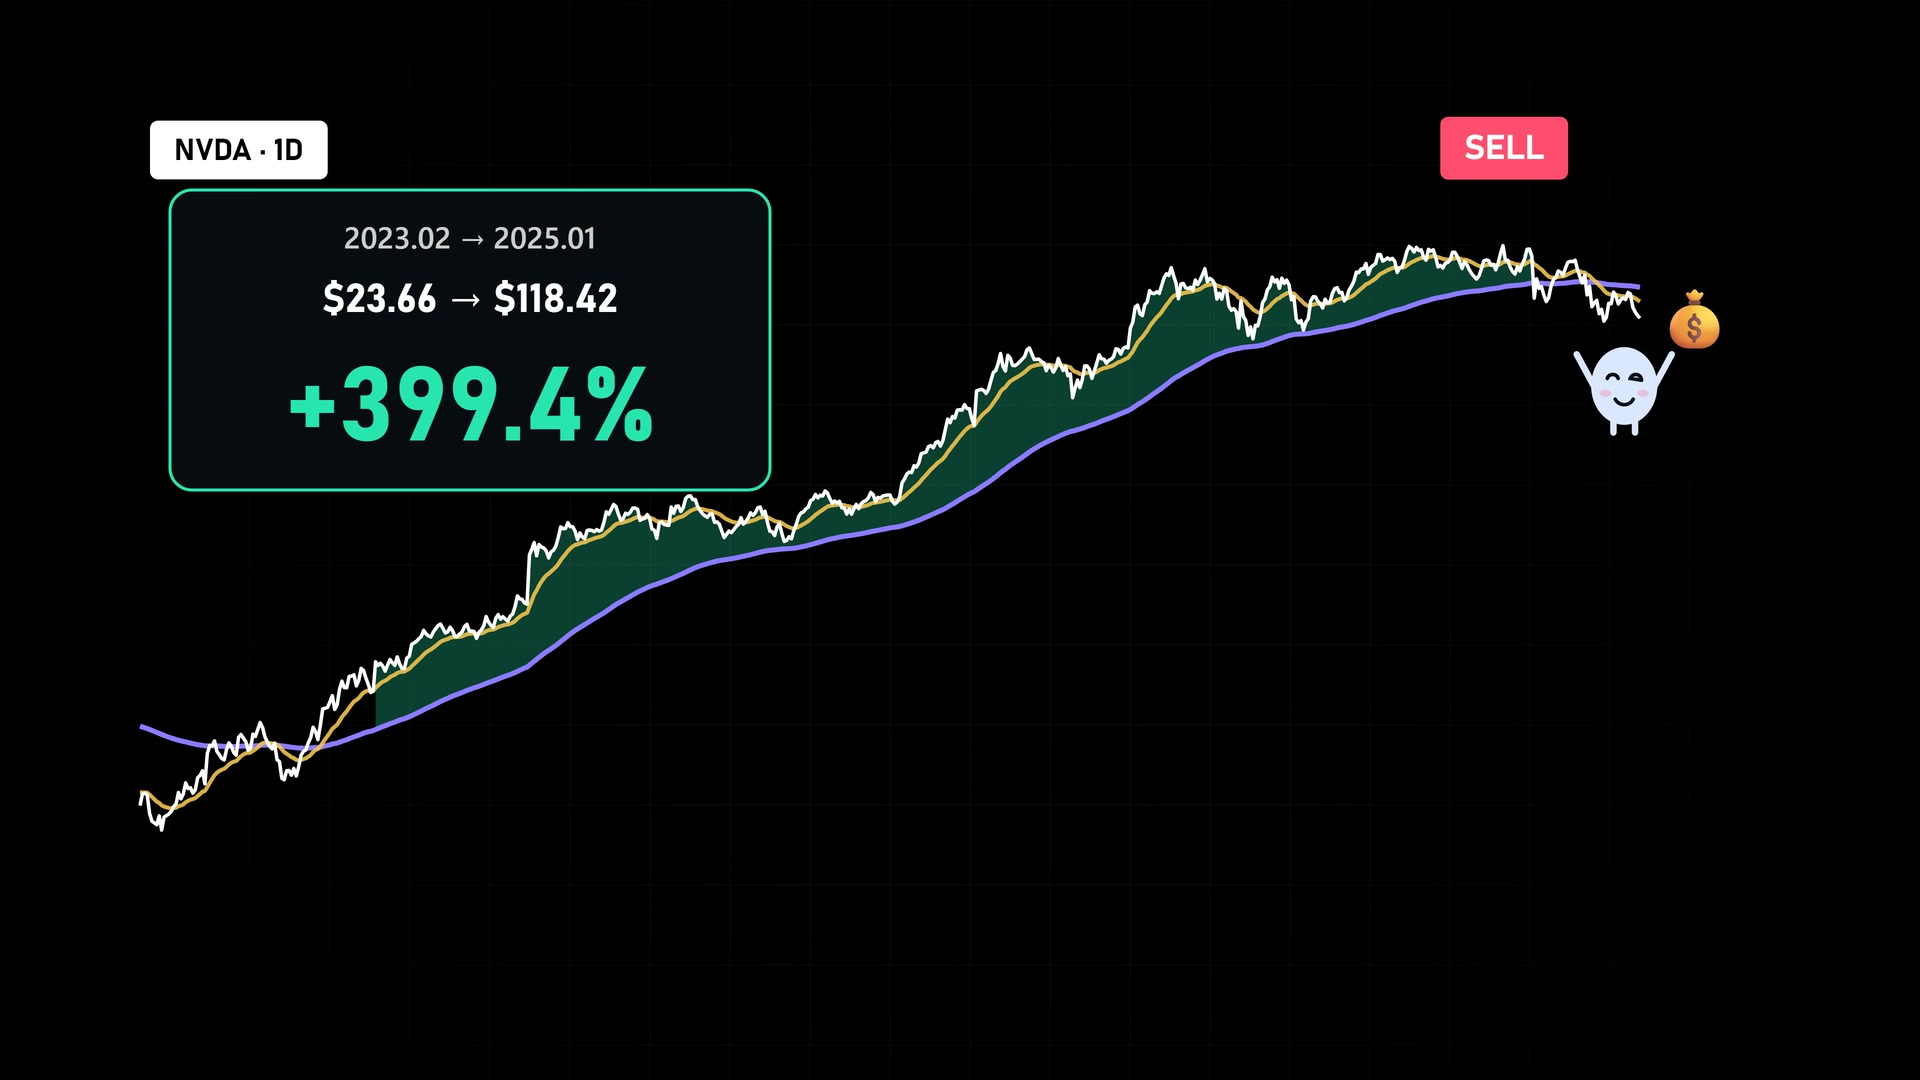
Bought the day it broke out of a 20-day pullback, sold the day the 150-day line broke. SPY made +49.6% over the same period.
On 23 Feb 2023 the buy signal locked in at the $23.66 close. On 27 Jan 2025 the close fell below the 150-day line and it sold at $118.42.
Signal and fill at that day's close, 0.1% cost on buy and sell · a replay of the same rule as the TradingView indicator (split-adjusted prices)
Download the calculation record (JSON) ↓Chased a stock that was already flying and got stuck at the top
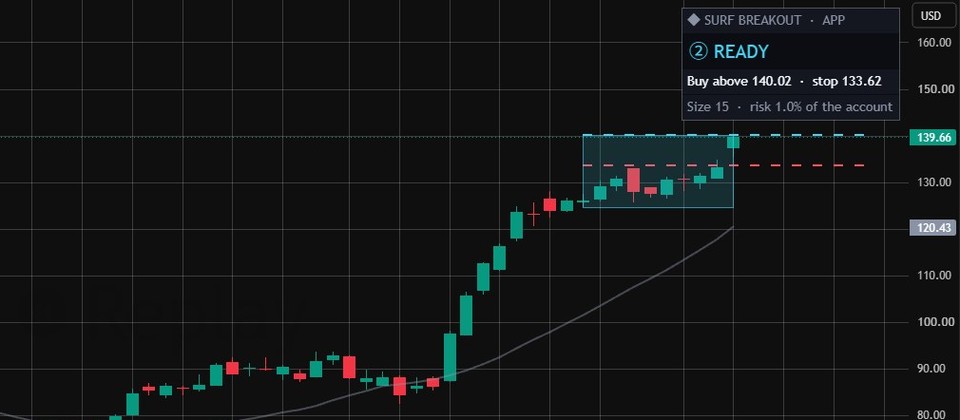
It waits for a strong trend to dip to the 20-day line (◆) and buys only when price clears the high within 3 days
Sold far too early because a small gain made me nervous
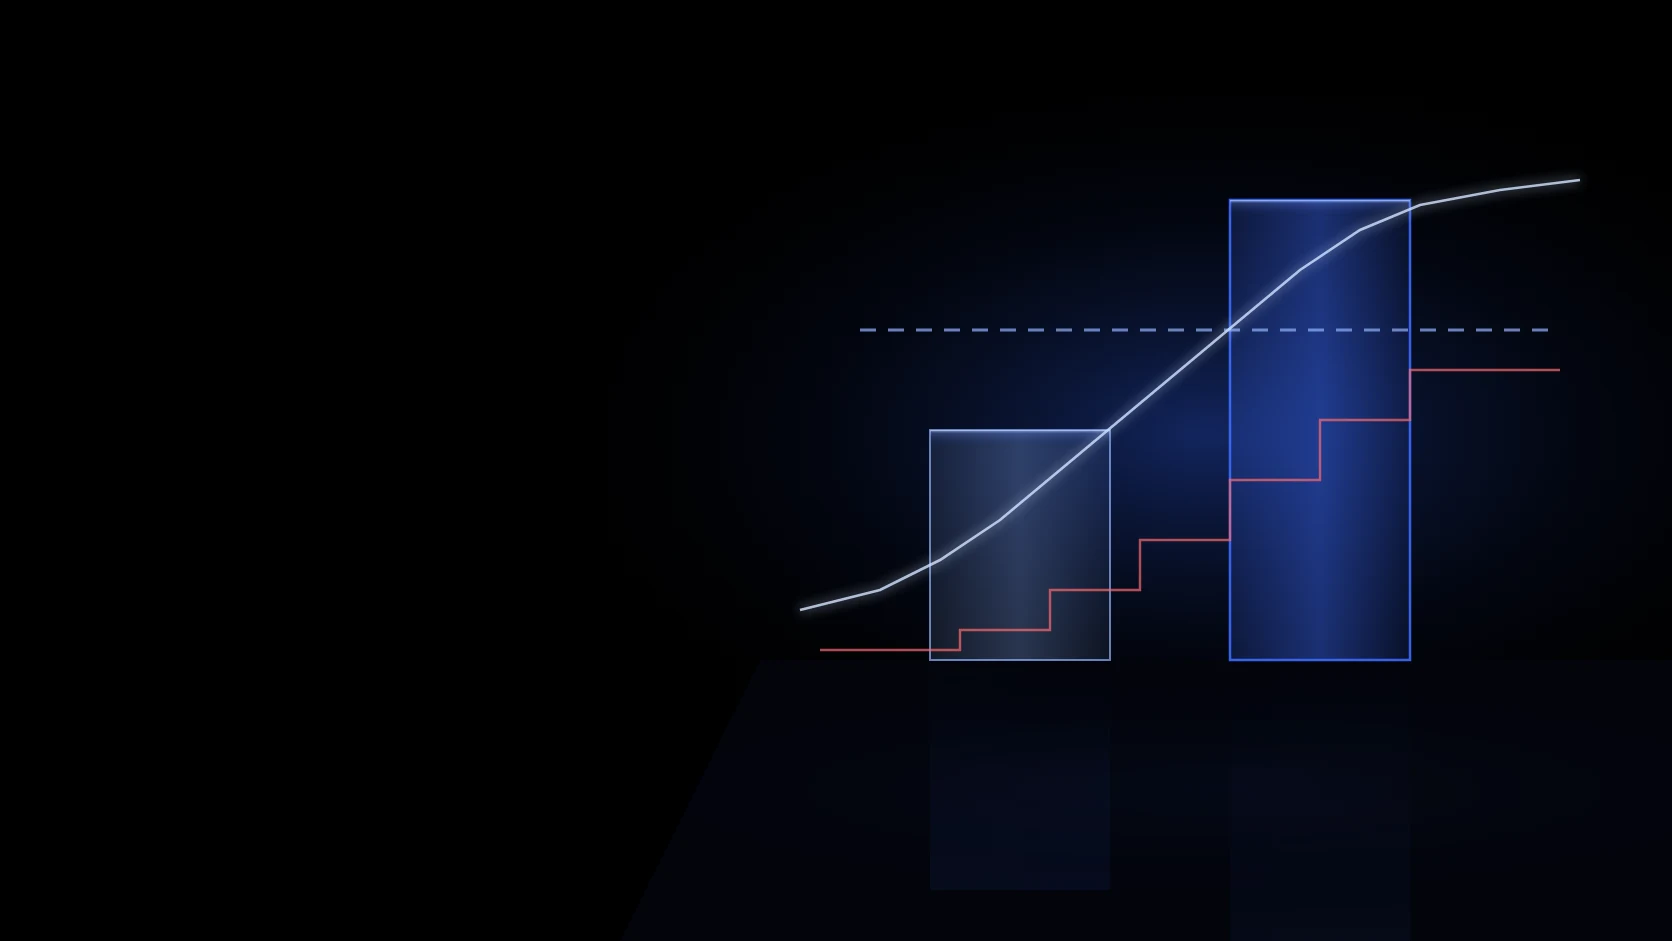
It holds until the close drops below the 150-day line, riding the whole trend
A buy signal showed up, then quietly disappeared
Buys and sells are confirmed on the close only, so signals never repaint
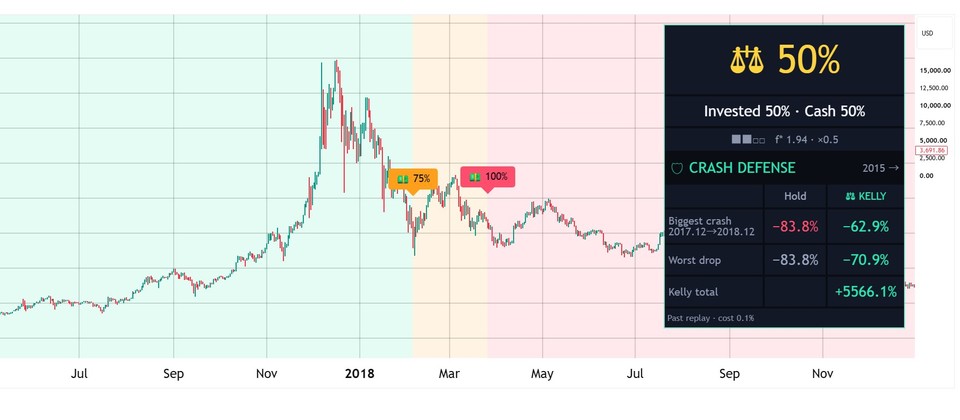
Held on through a crash and lost big
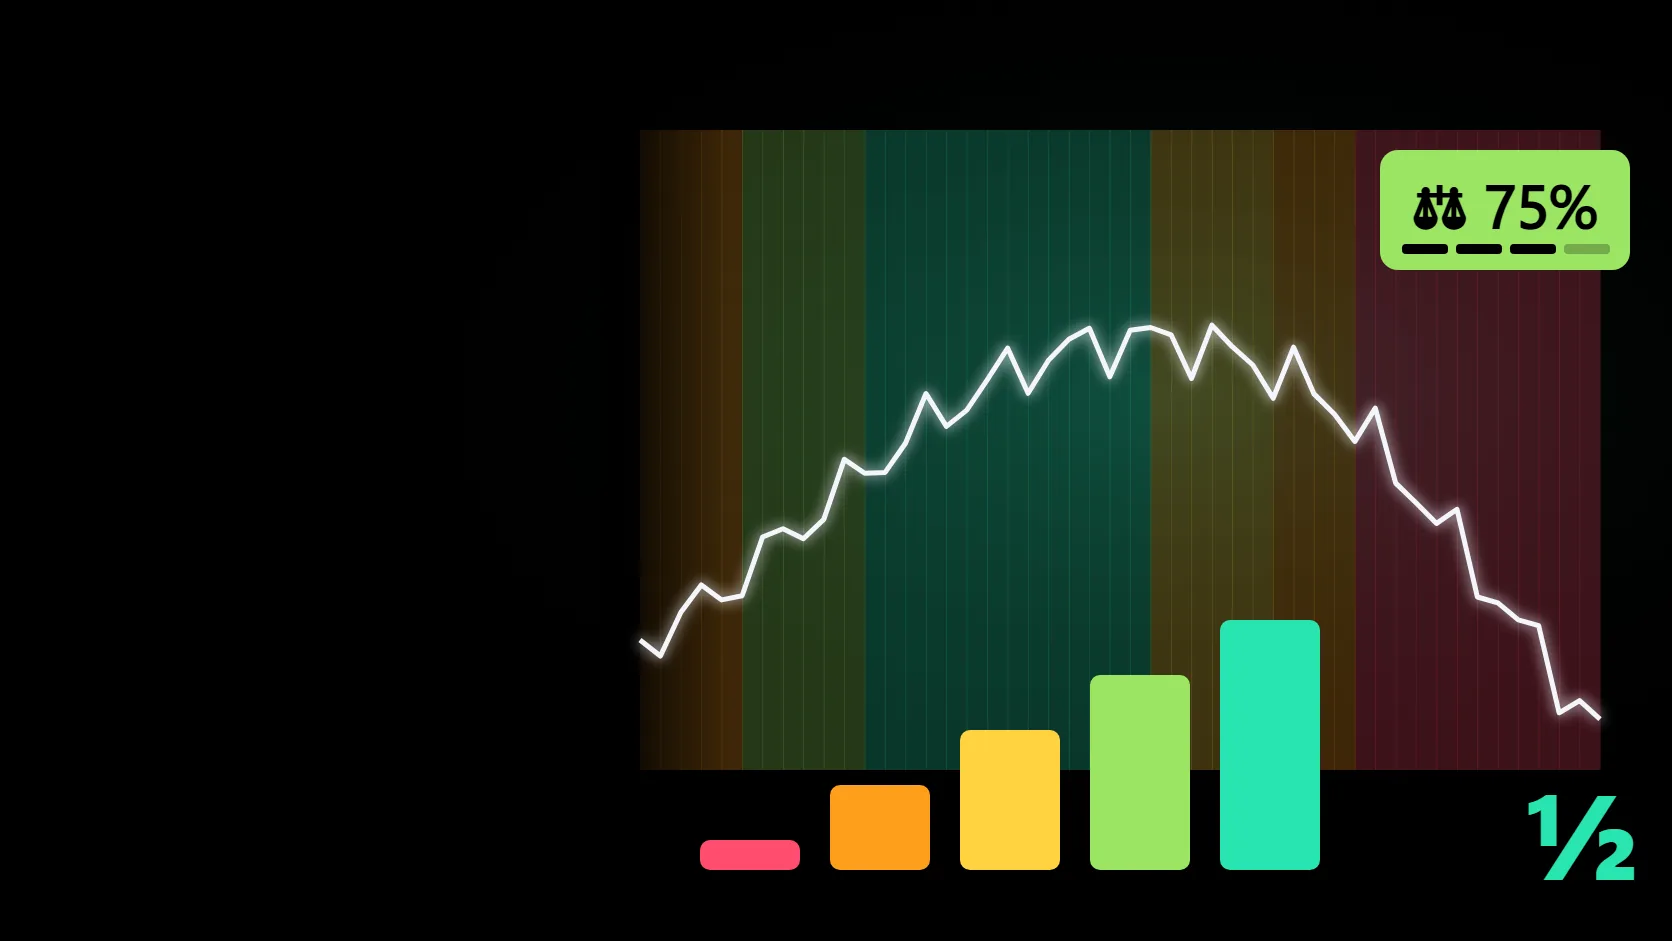
Below the 150-day line it does not buy and sits in cash
In a strong uptrend (ADX above 20, +DI > −DI, above the 150-day line) a low touching the 20-day line marks ◆; a close above that candle's high within 3 days gives 🏆 BUY.
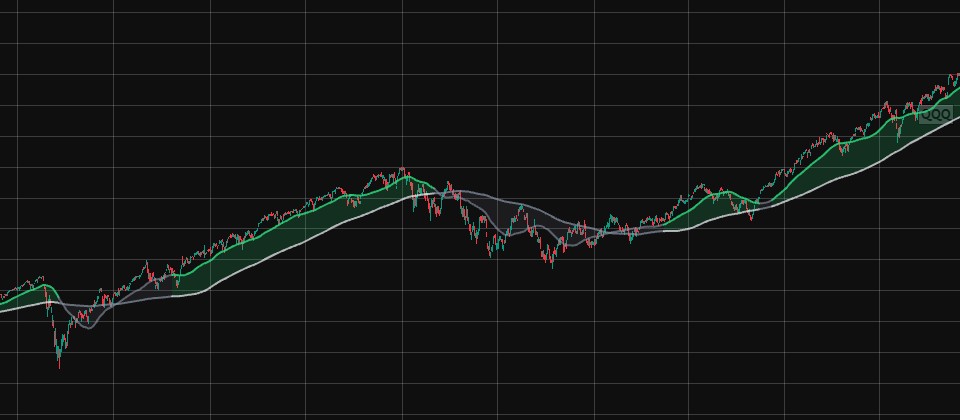
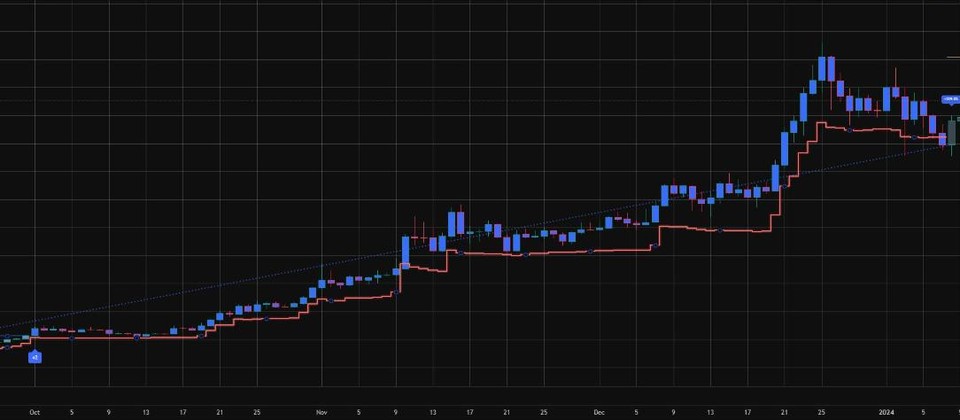
It sells only when the close drops below the 150-day line. While you hold, a green ribbon fills the space between price and that line.
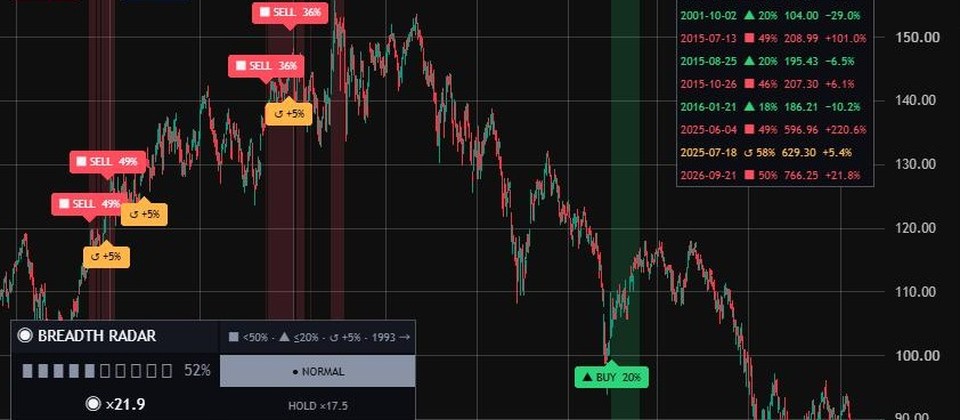
One card shows the state (riding the trend / pullback — waiting for the trigger / waiting for a strong trend), biggest crash, worst drop, trades and total return.
Wait for a ◆ pullback at the gold 20-day line, then ride the green ribbon above the purple 150-day line. Card and alerts in 8 languages.
After 🏆 BUY it held along the green ribbon and sold the day the 150-day line broke: +400.4% on screen, +399.4% after 0.1% cost per side.
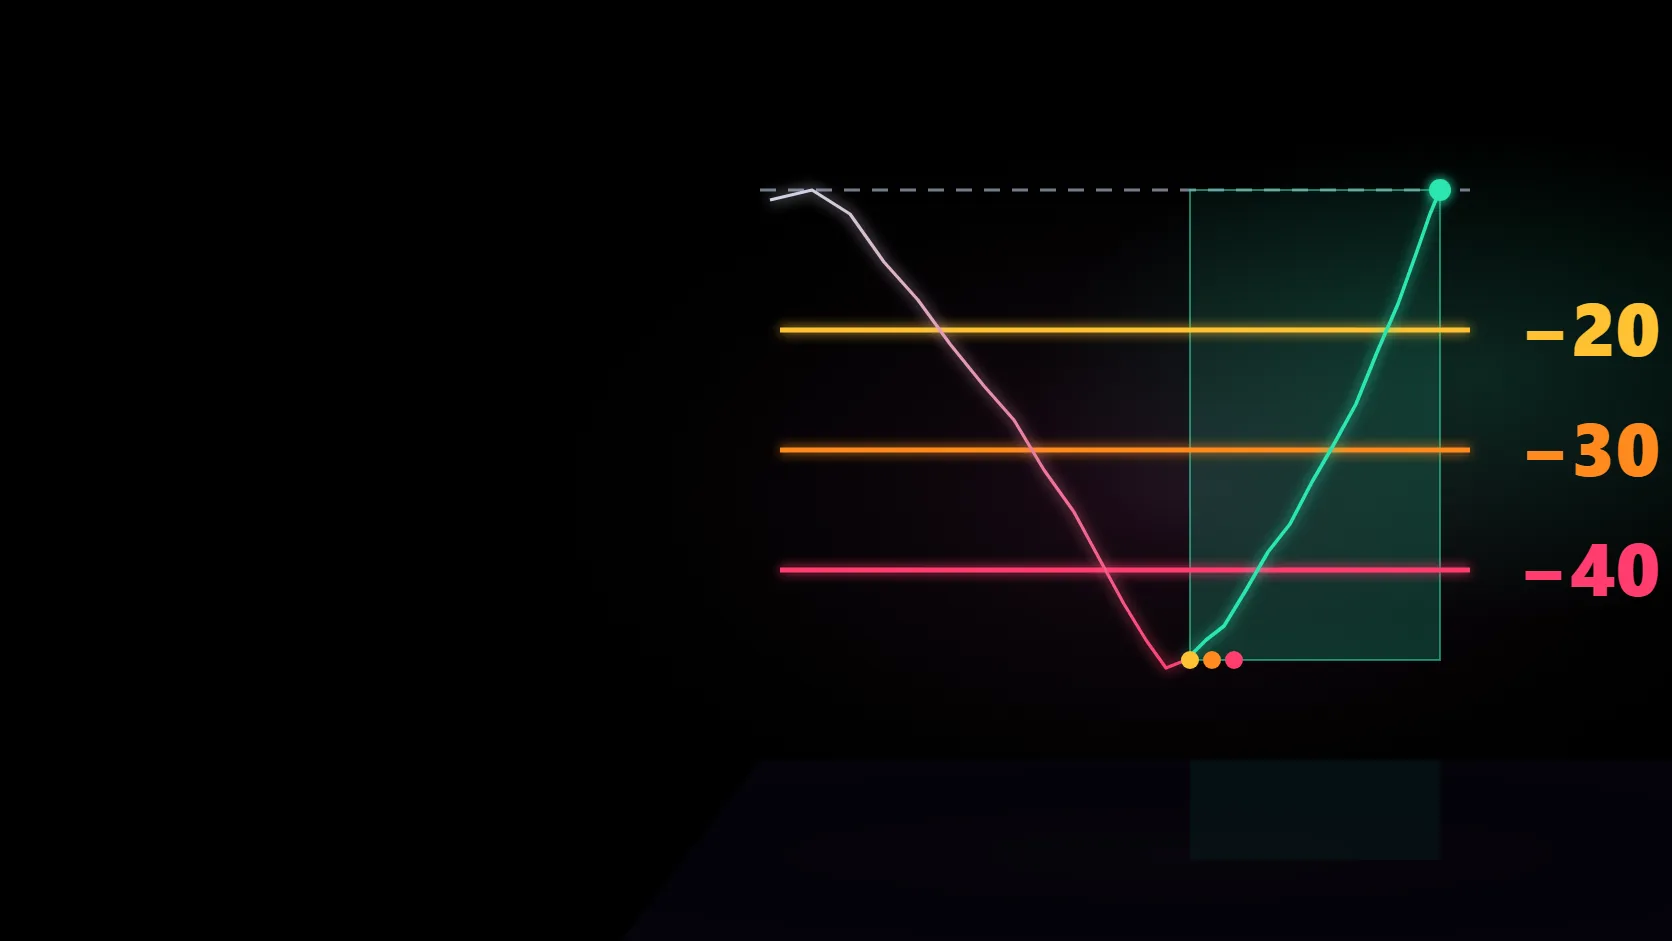
Through the 2007.10–2009.3 crash, when holding lost −56.5%, it stayed in cash below the 150-day line (0%).
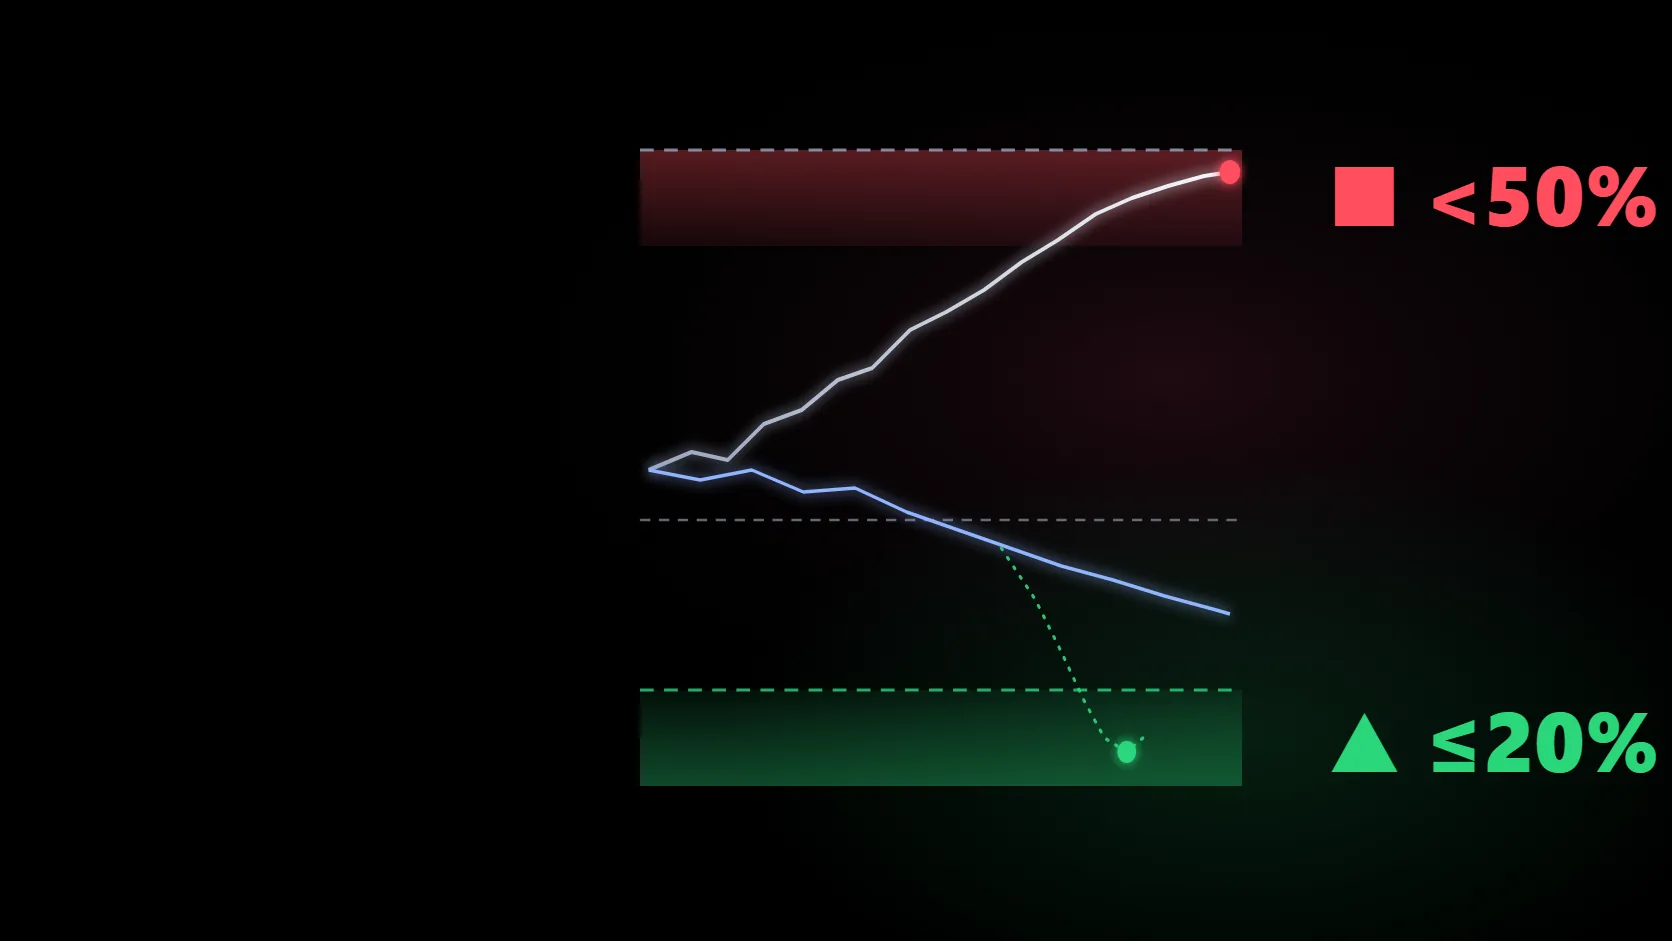
Ten markets, from stocks and indexes to crypto and gold: the worst drop when simply holding versus with Grail Pullback.
| Market | From | Hold: worst drop | Grail Pullback: worst drop |
|---|---|---|---|
| S&P 500 (SPY) | 2001 | −56.5% | −26.1% |
| Nasdaq 100 (QQQ) | 2001 | −70.4% | −42.6% |
| Nvidia | 2001 | −89.7% | −53.2% |
| Tesla | 2011 | −73.6% | −53.8% |
| Apple | 2001 | −60.9% | −32.8% |
| Meta | 2013 | −76.7% | −27.3% |
| Bitcoin | 2015 | −83.4% | −68.9% |
| Gold | 2001 | −44.4% | −26.4% |
| AMD | 2001 | −96.2% | −54.0% |
| Microsoft | 2001 | −59.1% | −29.6% |
Because it rests below the 150-day line, losses in big crashes shrank like this (0.1% cost on every buy and sell).
2008 crisis S&P 500 (2007.10–2009.3) — holding lost −56.5%. The indicator was in cash the whole time.
Covid crash S&P 500 (2020.2–3) — holding lost −34.1%. The indicator held nothing during the fall.
2022 bear market Nasdaq 100 — holding lost −35.6%. Following the indicator, the loss stopped here.
No monthly fee: one payment gets you the full Pine Script v6 source to keep and edit.
Past performance does not guarantee future results.
Inspired by Linda Raschke's setup and built by ChartArmory; not affiliated with or endorsed by Raschke.
Instead of chasing a spike, it waits for a strong trend to pause (◆) and buys when it starts rising again: a close above that candle's high within 3 days.
The original 'Holy Grail' in her 1995 book Street Smarts is a trade of a few days. This indicator sells only when the close falls below the 150-day line, to ride the whole trend.
No. Buys and sells are set on closed candles only, so they never repaint. Long only.
Rarely. Since 2018 the median across 35 markets was about one trade a year, holding about 35% of the time and sitting in cash otherwise.
Dot-com Nasdaq 100 (2000.3–2002.10) −83.0% → −25.3%, Meta (2021.9–2022.11) −76.7% → −18.4%, Bitcoin (2021.11–2022.11) −76.6% → −27.3%.
You can edit it for personal use. Sharing, redistribution and resale rights are not included.
Put Grail Pullback's full source and scorecard on your TradingView chart today.
Breakout step checker
POSITION SIZER
LEADER ROTATION
TOP WARNING
CRASH BUYING
POSITION SIZING
TREND BREAKOUT
VOLATILITY BREAKOUT
LONG-TERM TREND
REBOUND OBSERVATION
BREAKOUT OBSERVATION
LIVERMORE · V3
TREND OBSERVATION
TradingView