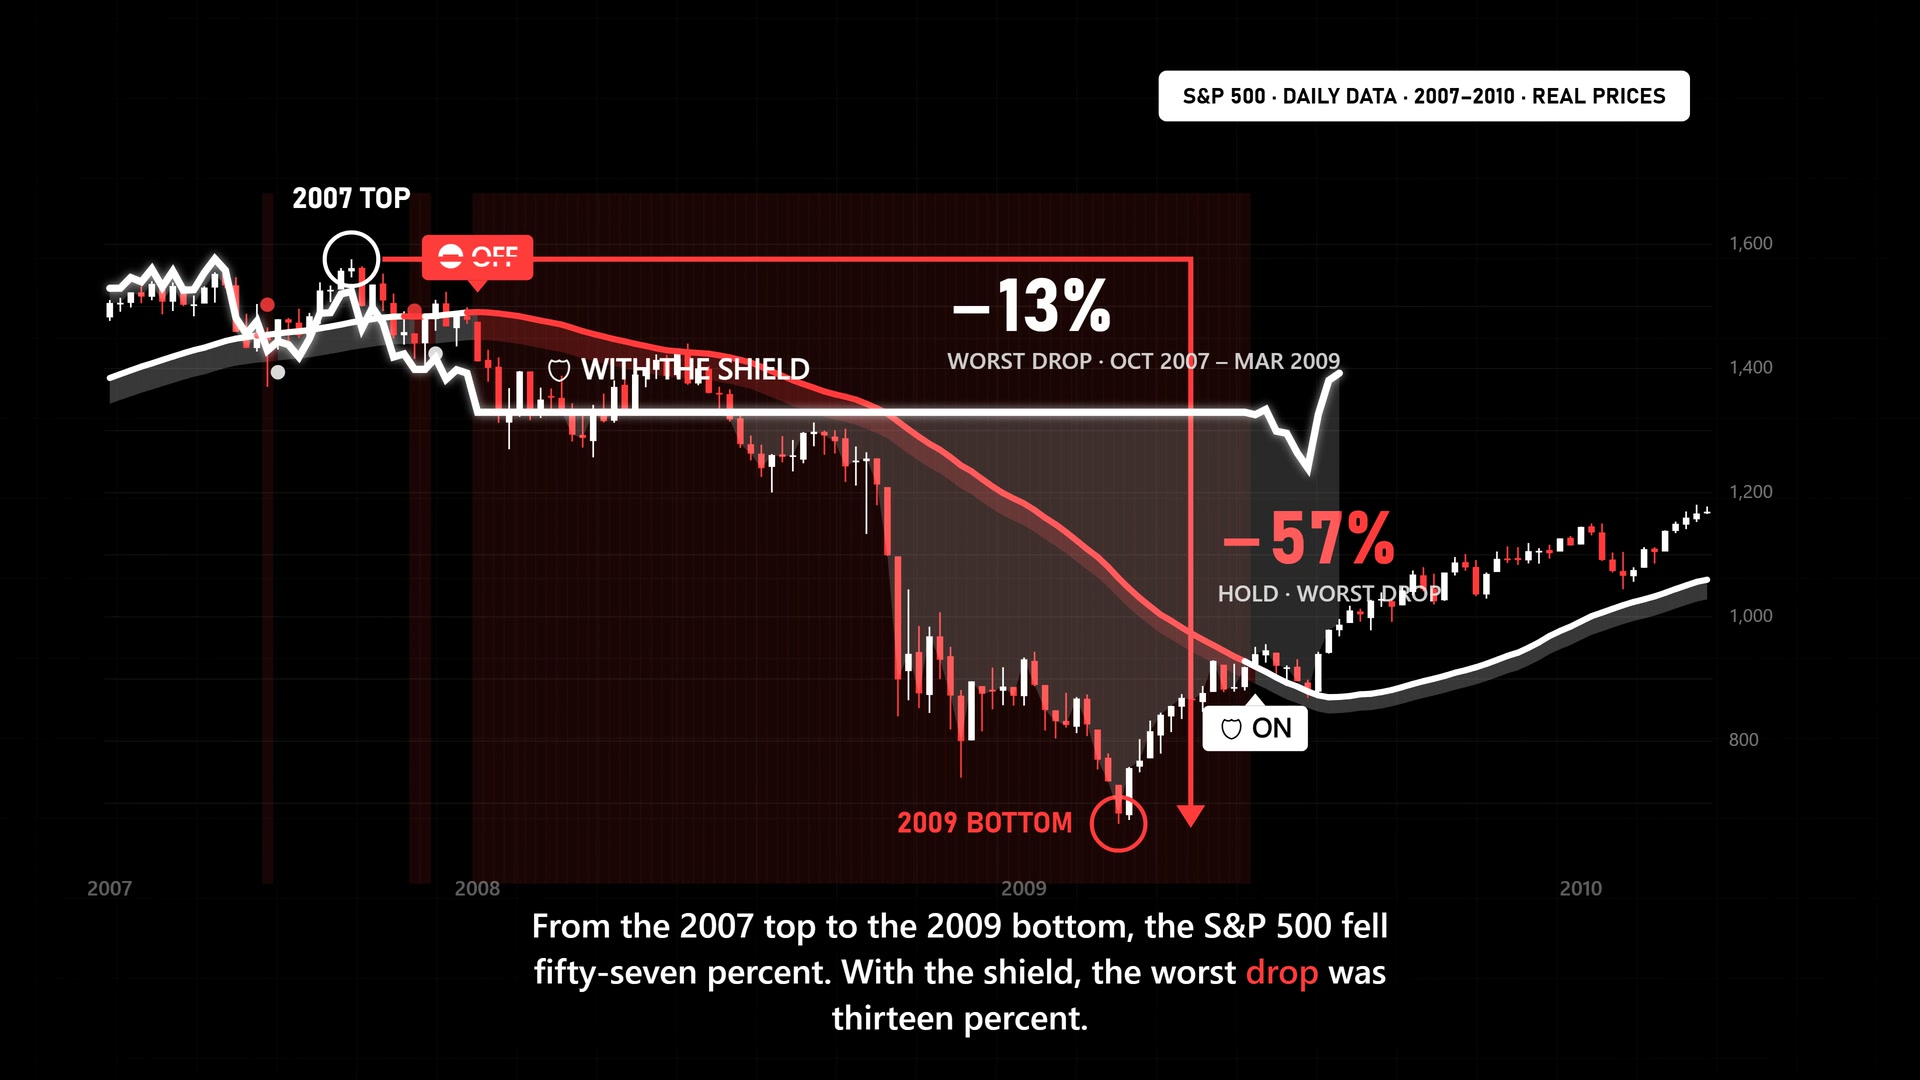
⛔ OFF · Defend
Turns on the day the daily close drops more than 3% below the 200-day line. From the next bar, the panel's shield simulation counts you as out of the market (in cash).
Break 3% below the 200-day line: ⛔ OFF, head for cover! Climb back above it: 🛡 ON, back on the attack!
Confirmed ON close → confirmed OFF close · before costs
A real chart period on KOSPI daily with the default settings (200-day average · 3%), recorded from ON to OFF.
On May 7, 2025, KOSPI closed above its 200-day line and 🛡 ON (2,573.80) lit up. It rode the uptrend until ⛔ OFF (6,035.35) on October 13, 2026: +134.5% (+134.02% after costs).
Return = (OFF close ÷ ON close − 1) × 100. A simple calculation that assumes a fill at the signal day's close; dividends, tax and slippage are not included.
You hesitate, miss the exit and ride it all the way to the basement
The moment a close breaks −3% under the 200-day line: ⛔ OFF, straight to cash
You panic-sell small dips, then buy back at the top
A 3% buffer ignores the shakeouts; 🛡 ON only on a full reclaim of the 200-day line
You can't easily test whether it works on your own ticker
One chart panel compares hold vs Shield return and max drawdown in a second
Turns on the day the daily close drops more than 3% below the 200-day line. From the next bar, the panel's shield simulation counts you as out of the market (in cash).
Turns on the day the daily close gets back above the 200-day line. From the next bar, the panel counts you as holding again.
Shows the current state (🛡 ON / ⛔ OFF), the distance to the 200-day line and how much room is left before OFF, live. At the same time it uses the chart you have open to compare Buy & Hold vs Shield vs Shield ×2: yearly return, max drop and number of switches, side by side.
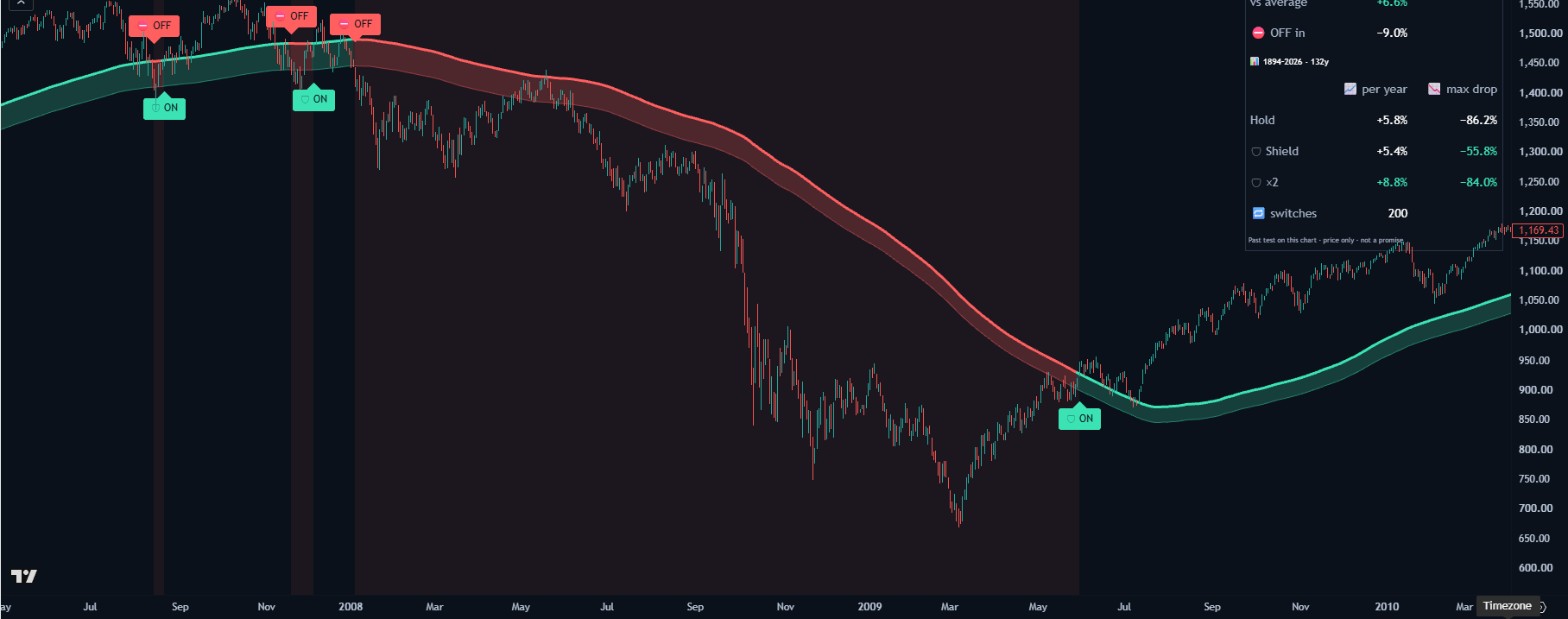
⛔ OFF on 2008-01-04, back 🛡 ON on 2009-06-01: while the S&P 500 fell −56.8%, the drawdown was held to −13.0%.
No cherry-picked periods: the numbers shown on the real daily-chart panels, copied as they are. These are historical results and do not guarantee future returns.
| Chart | Strategy | Per year | Max drop | Switches | Data |
|---|---|---|---|---|---|
| AMEX:SPY | Buy & hold | +8.9% | −56.5% | — | TradingView 1D |
| AMEX:SPY | 🛡 Shield | +6.6% | −28.9% | 68 | TradingView 1D |
| AMEX:SPY | 🛡 Shield ×2 | +11.2% | −50.8% | 68 | TradingView 1D |
| KRX:KOSPI | Buy & hold | +9.0% | −75.4% | — | TradingView 1D · 1980– |
| KRX:KOSPI | 🛡 Shield | +9.8% | −41.5% | 105 | TradingView 1D · 1980– |
| KRX:KOSPI | 🛡 Shield ×2 | +16.3% | −66.7% | 105 | TradingView 1D · 1980– |
Historic crashes only: plain buy-and-hold vs 200 Shield (daily, 0.1% fee per side)
2008 crisis, SPY: holding took $1,000 to $515. Shield held the loss to −15.3% ($847)
2022 bear market, META: holding took $1,000 to $355. Shield: −4.4% ($956)
2022 bear market, Ethereum: holding took $1,000 to $317. Shield: −24.0% ($760)
No approval wait: after payment, copy the source code or download the file and apply it straight away.
Past performance does not guarantee future results.
Inspired by the principle the legendary trader Paul Tudor Jones stated: “My metric for everything I look at is the 200-day moving average” (Tony Robbins, Money: Master the Game, 2014). The indicator is code developed independently by ChartArmory, with no connection to or endorsement from Paul Tudor Jones.
It is the average price of about a year of trading days, and institutions and investors around the world use it as the key line between long bull and bear phases. Paul Tudor Jones also named the 200-day line as his yardstick. You can change the length freely in the settings.
Buying and selling every time price wiggles around the average only piles up trading costs and fatigue. On the S&P 500 (since 1985), a 3% buffer cut unnecessary switches from 270 to 72 (ChartArmory Python calculation).
Never. ON and OFF are decided only by confirmed daily closes, with no future data and no data from other timeframes. During the session (before the bar closes) the panel's live numbers can move with the current price.
Yes. It works on any TradingView chart, and the panel calculates returns and drops for that chart instantly. But in the 80-stock test it earned less than simply holding, so we recommend it most for stock indices and index ETFs on the daily chart.
You can edit it for personal use. Sharing, redistribution and resale rights are not included.
One US$39 payment: Pine Script v6 source, guides in 8 languages and 30 days of bug care.
TOP WARNING
CRASH BUYING
POSITION SIZING
TREND BREAKOUT
VOLATILITY BREAKOUT
REBOUND OBSERVATION
BREAKOUT OBSERVATION
LIVERMORE · V3
TREND OBSERVATION
TradingView