■ Narrow top: sell
Index within 3% of its high, under 50% of stocks above the 200-day: sell next day
Flags the narrow top: the index at a record while half its stocks are already down.
Holders melted −29.0% over 645 days; it waited in cash and bought back 40.7% more shares with the same money
On 27 Dec 1999, at S&P 500 highs, Breadth Radar flagged a hollow top and sold SPY at $146.50.
Closed-bar signals, next-open fills, 0.05% cost per side · real TradingView SPY daily record
Download the record used (JSON) ↓Counting 500 stocks against their 200-day line every day until your eyes give out
Open the chart and it reads the share of stocks above the 200-day for you
Toasting the “Nasdaq record high!” headline
Index smiling but hollow inside (over half below the 200-day)? A ■ sell alarm, no mercy
Hands shaking in a bloodbath, not knowing when to buy back
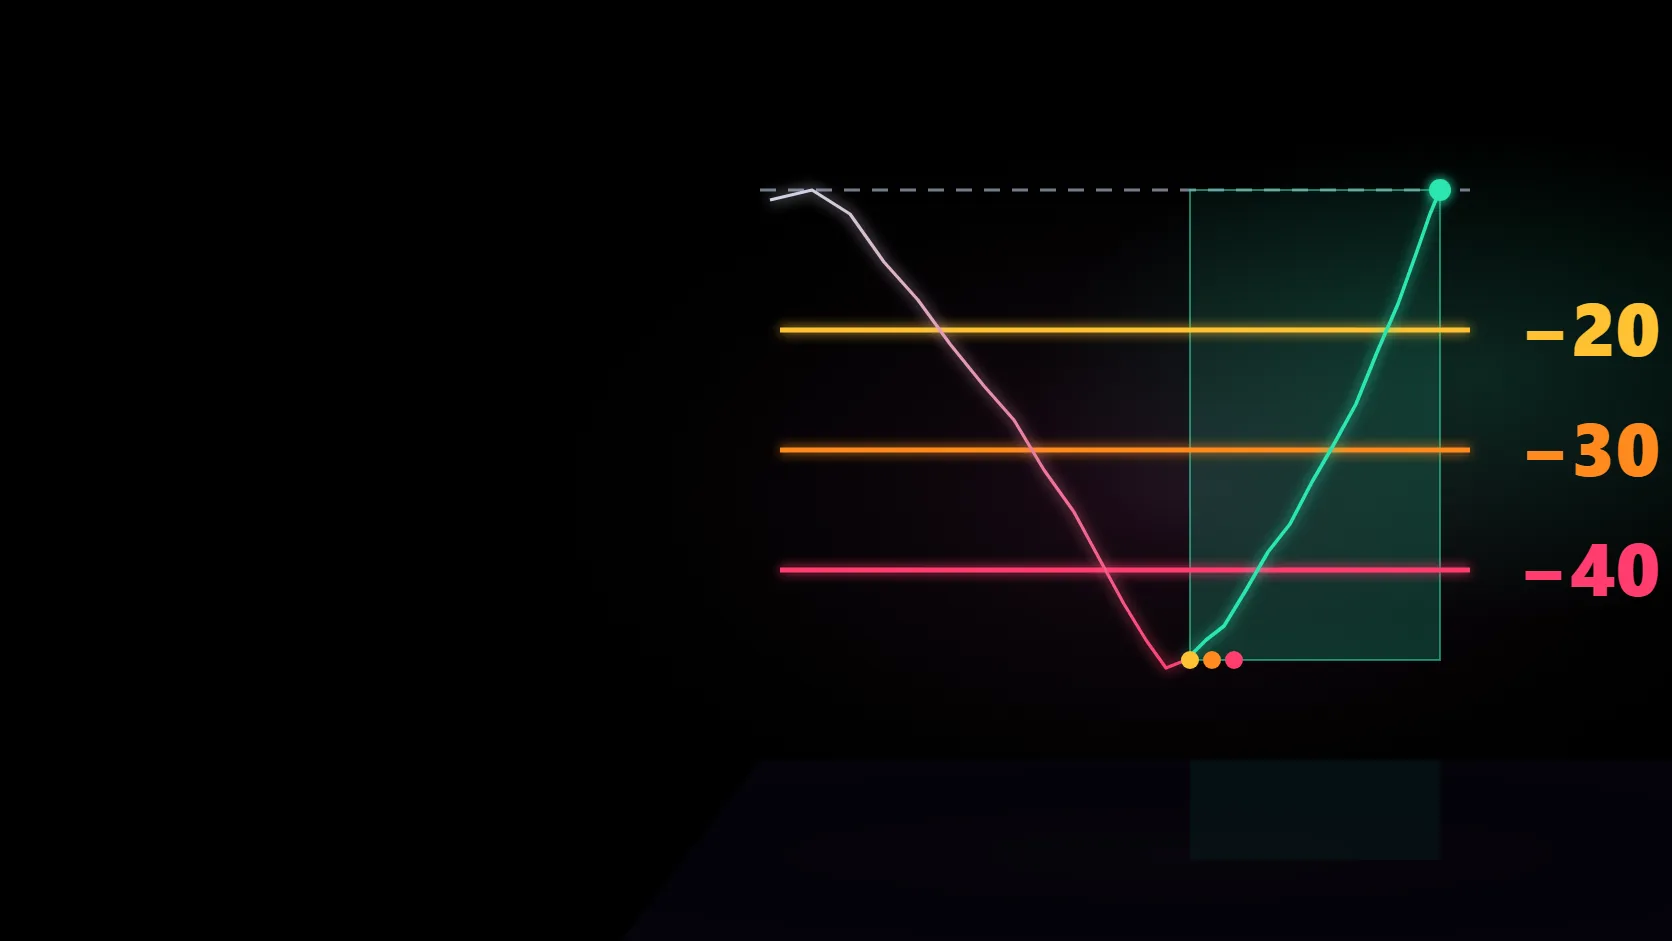
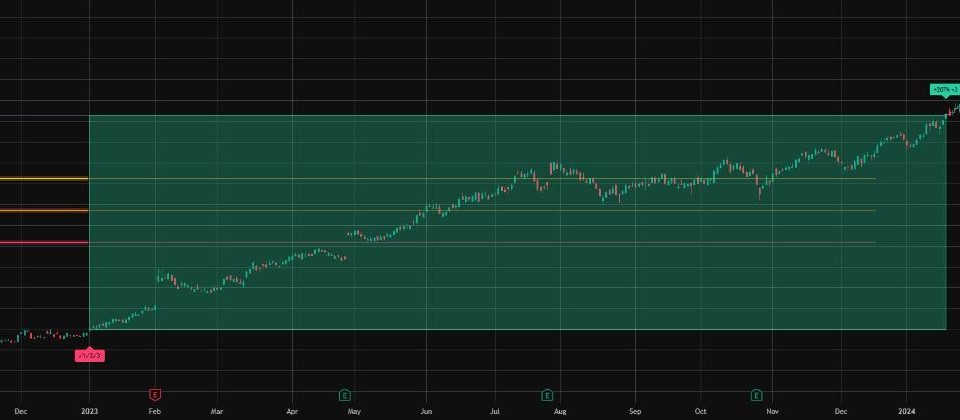
When 20% or fewer stocks stay above the 200-day, the ▲ bottom buy signal lights up
Index within 3% of its high, under 50% of stocks above the 200-day: sell next day
20% or fewer stocks above the 200-day: buy it all back next day
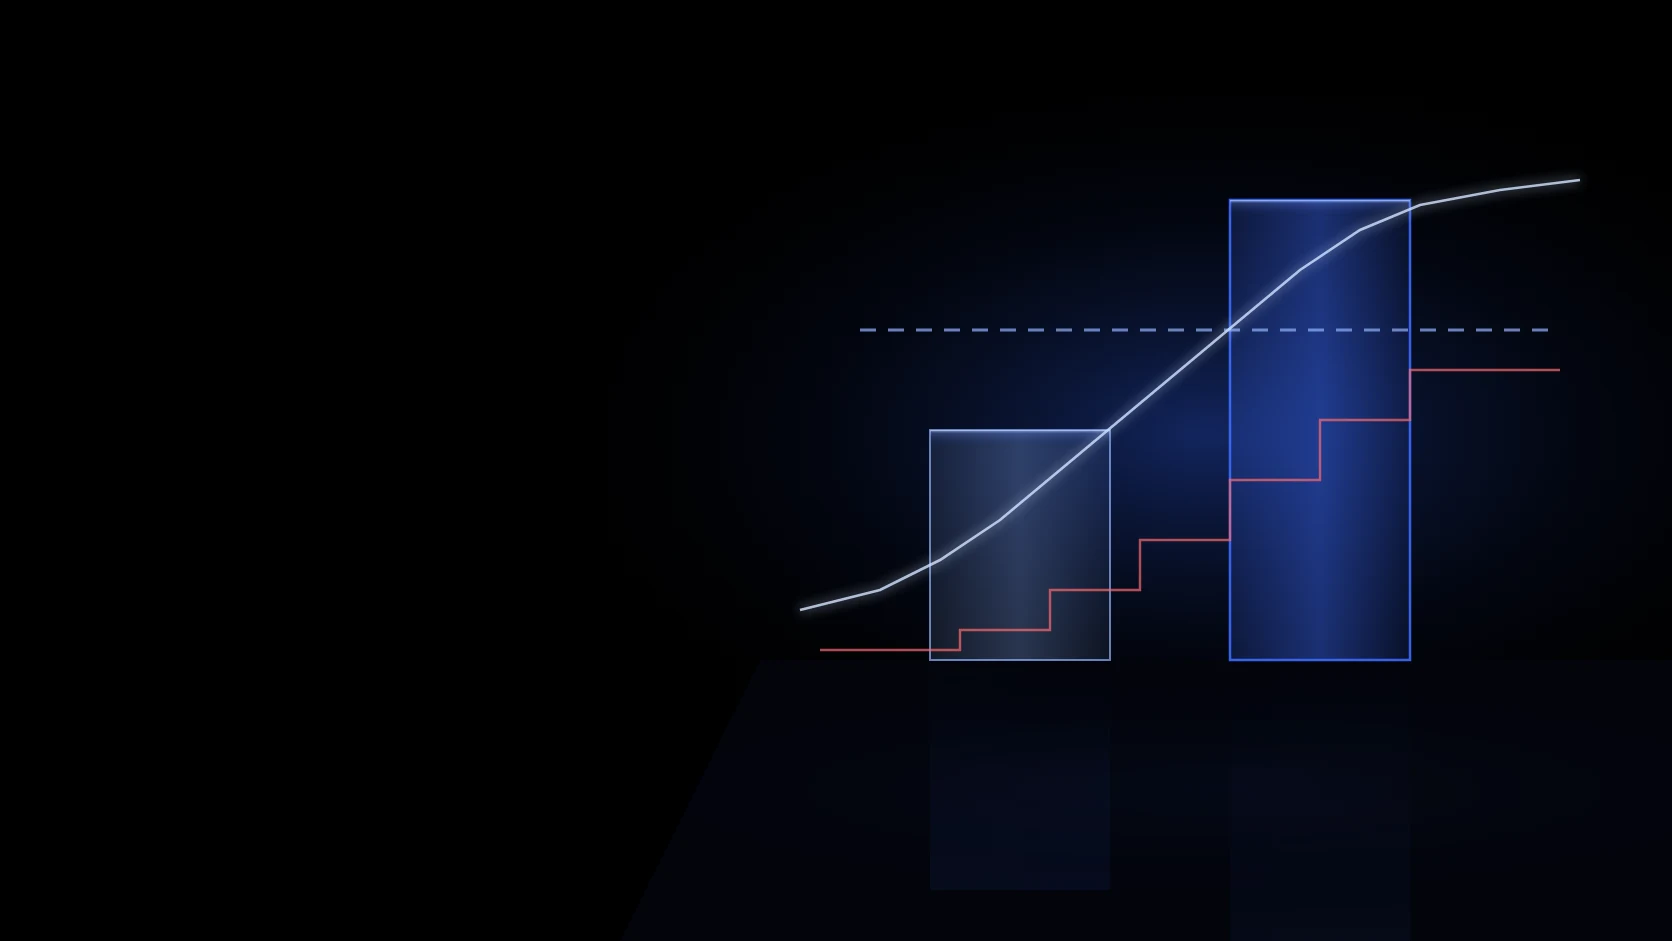
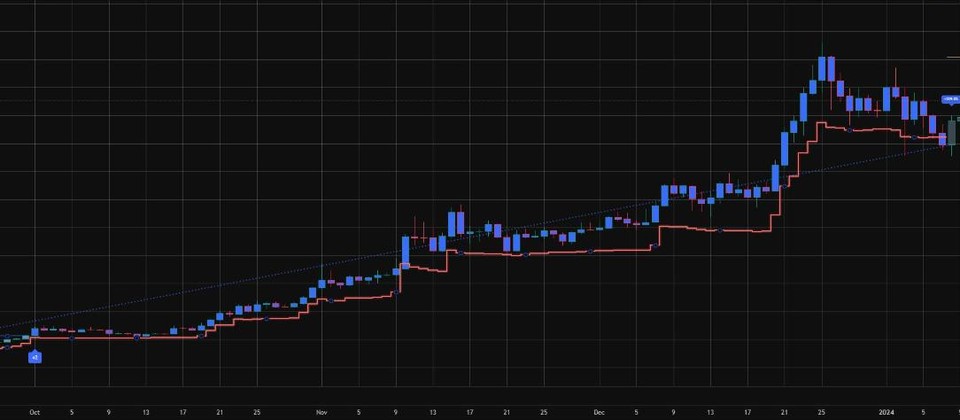
After a sell, the index rises 5% above the sell price: buy back next day
| Market | Start year | Indicator return | Buy & hold return | Indicator max drawdown | Hold max drawdown | Trades |
|---|---|---|---|---|---|---|
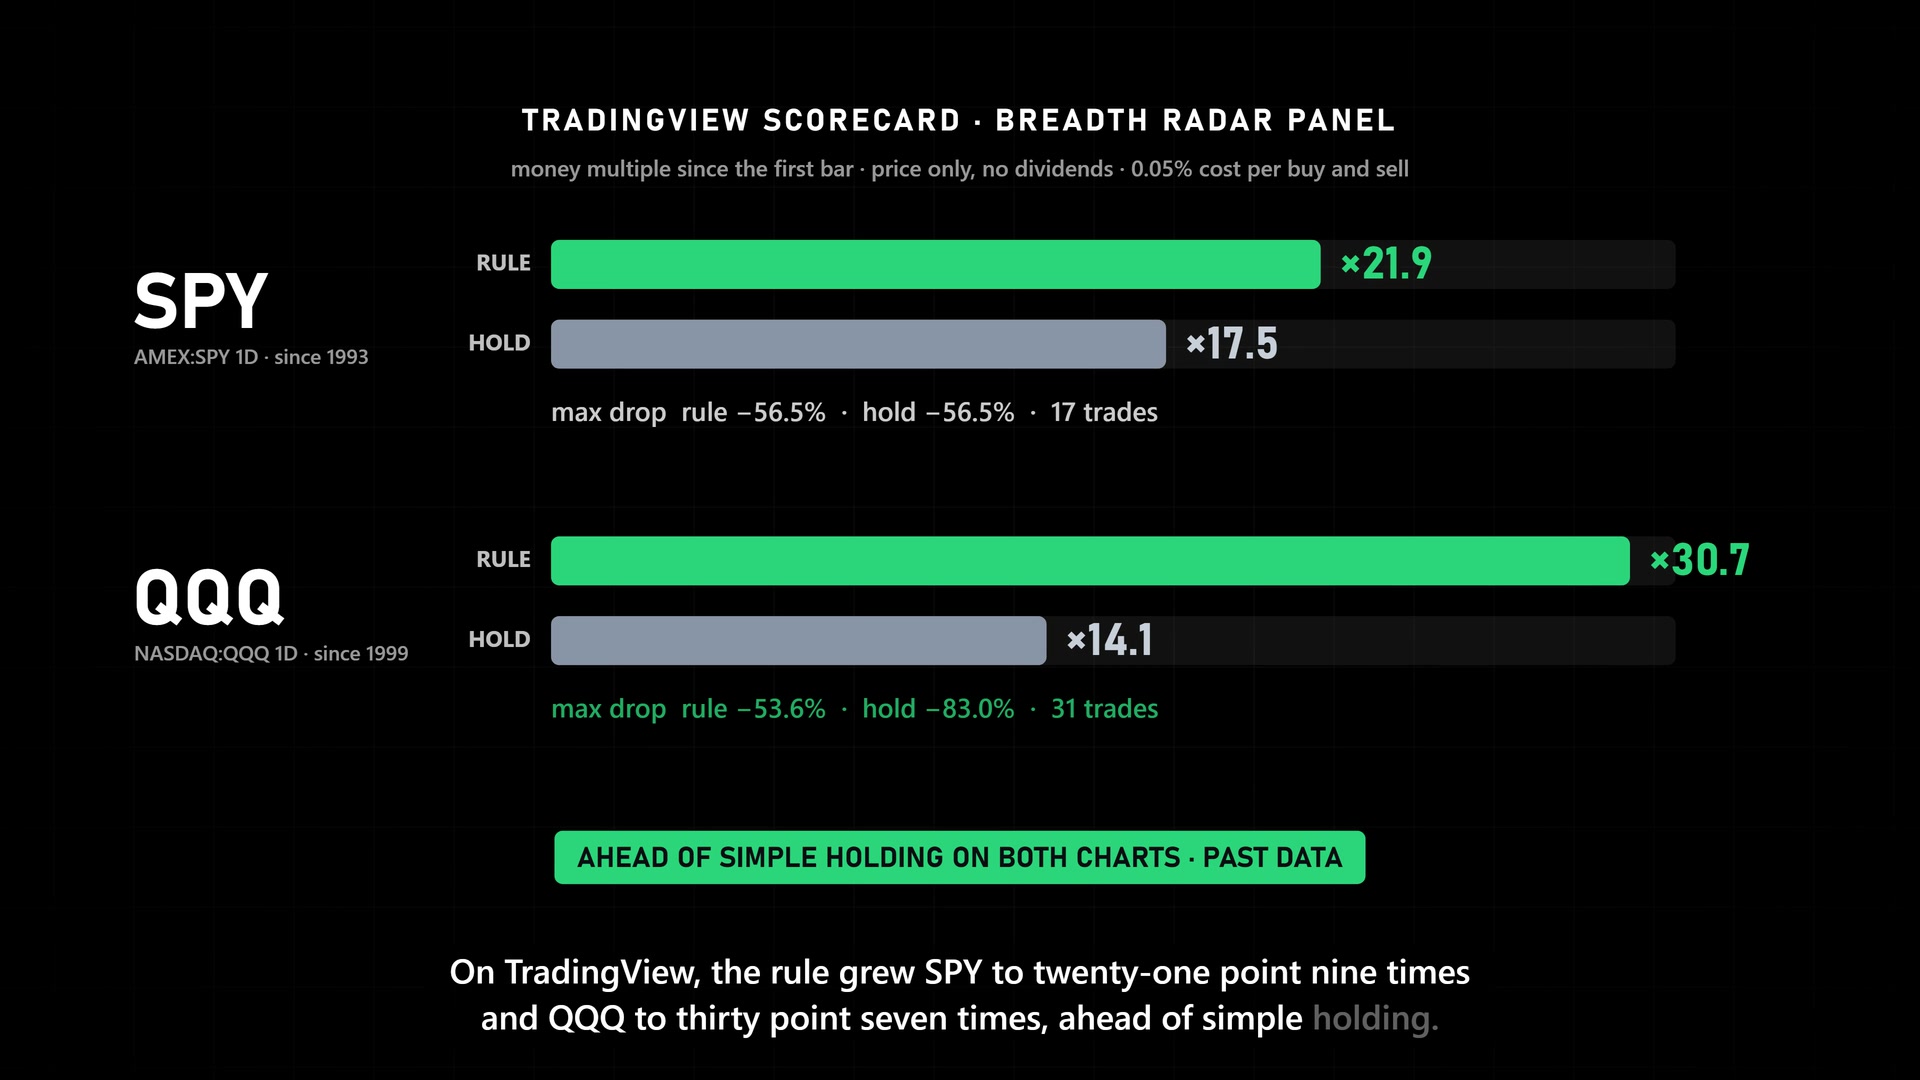
| S&P 500 (SPY)AMEX:SPY 1D | 1993 | $10,000 → $219,000 (21.9×) | $10,000 → $175,000 (17.5×) | −56.5% | −56.5% | 17 |
| Nasdaq 100 (QQQ)NASDAQ:QQQ 1D | 1999 | $10,000 → $307,000 (30.7×) | $10,000 → $141,000 (14.1×) | −53.6% | −83.0% | 31 |
The drops you miss watching only the index · TradingView daily scorecards (QQQ since 1999, SPY since 1993)
Nasdaq 100 deepest drop since 1999: Just holding −83.0% → following the indicator −53.6%
Dec 1999 ■ exit ($146.50) to Oct 2001 ▲ re-entry ($104.00): the SPY slide that just holding took.
Past performance does not guarantee future results.
An independent ChartArmory tool inspired by the breadth readings Michael Burry described in his public newsletter; not affiliated with or endorsed by him.
It was inspired by his October 2026 Substack post, but ChartArmory built it independently.
It decides on closed daily bars and fills at the next open, so it never repaints.
US$59 once for the Pine Script v6 source, yours to keep
Delivery & refund policy ↗CRASH BUYING
POSITION SIZING
TREND BREAKOUT
VOLATILITY BREAKOUT
LONG-TERM TREND
REBOUND OBSERVATION
BREAKOUT OBSERVATION
LIVERMORE · V3
TREND OBSERVATION
TradingView