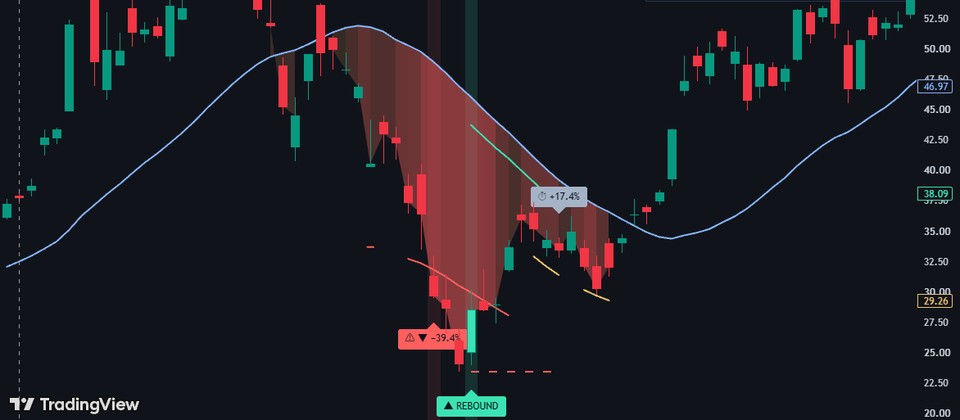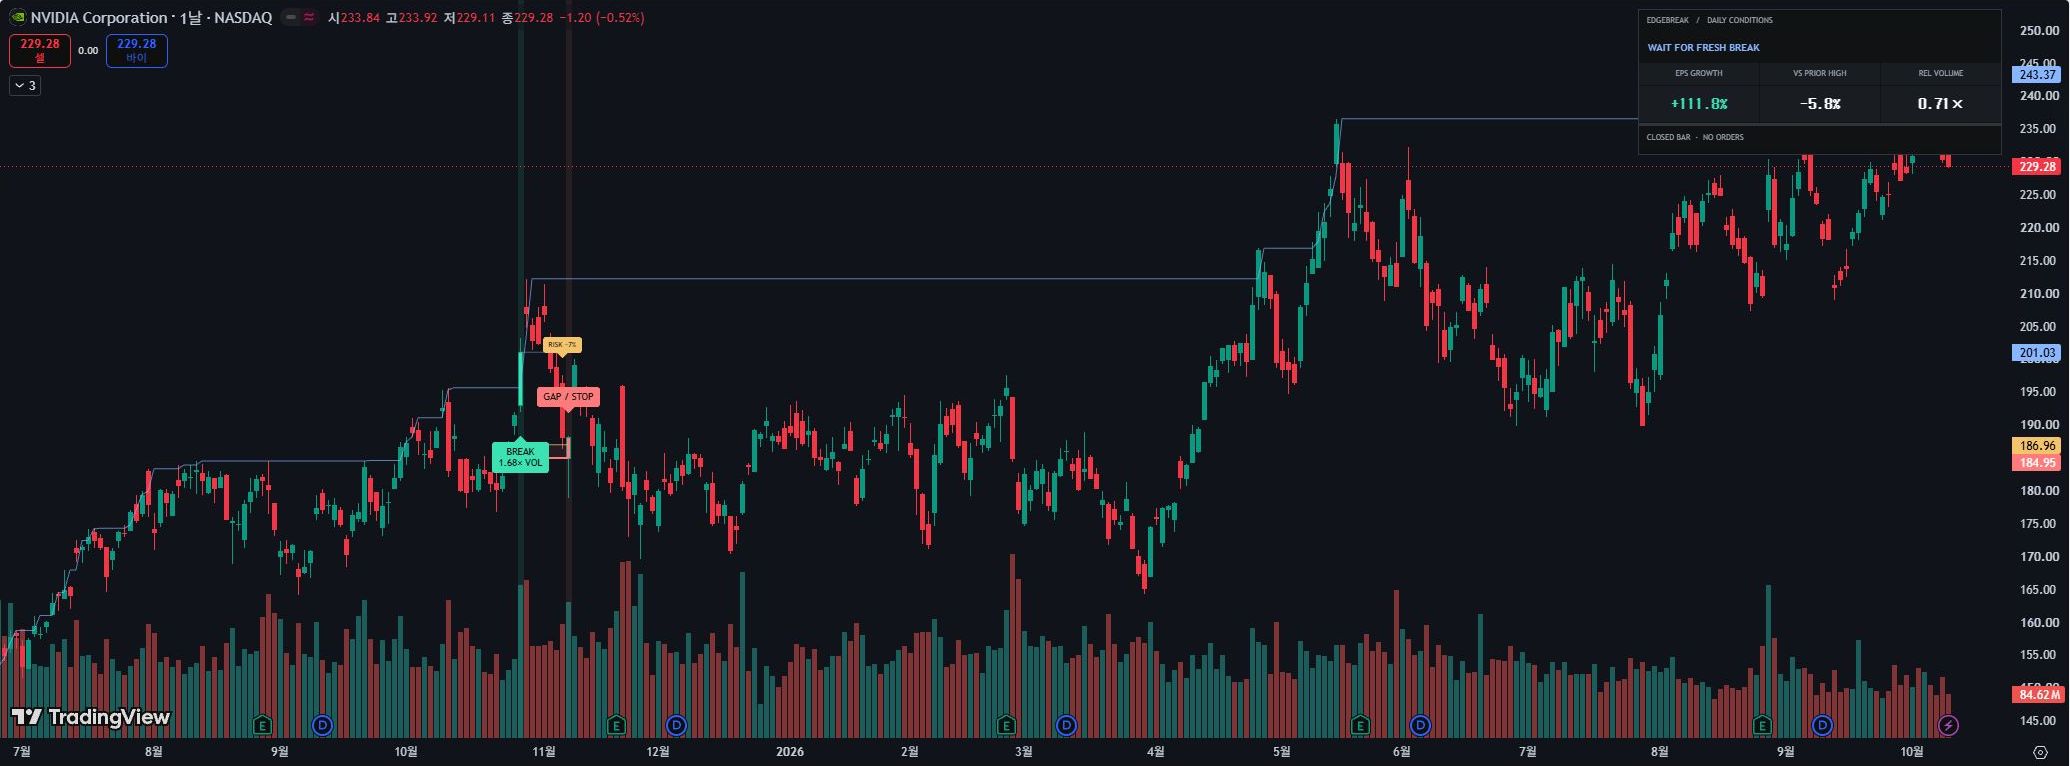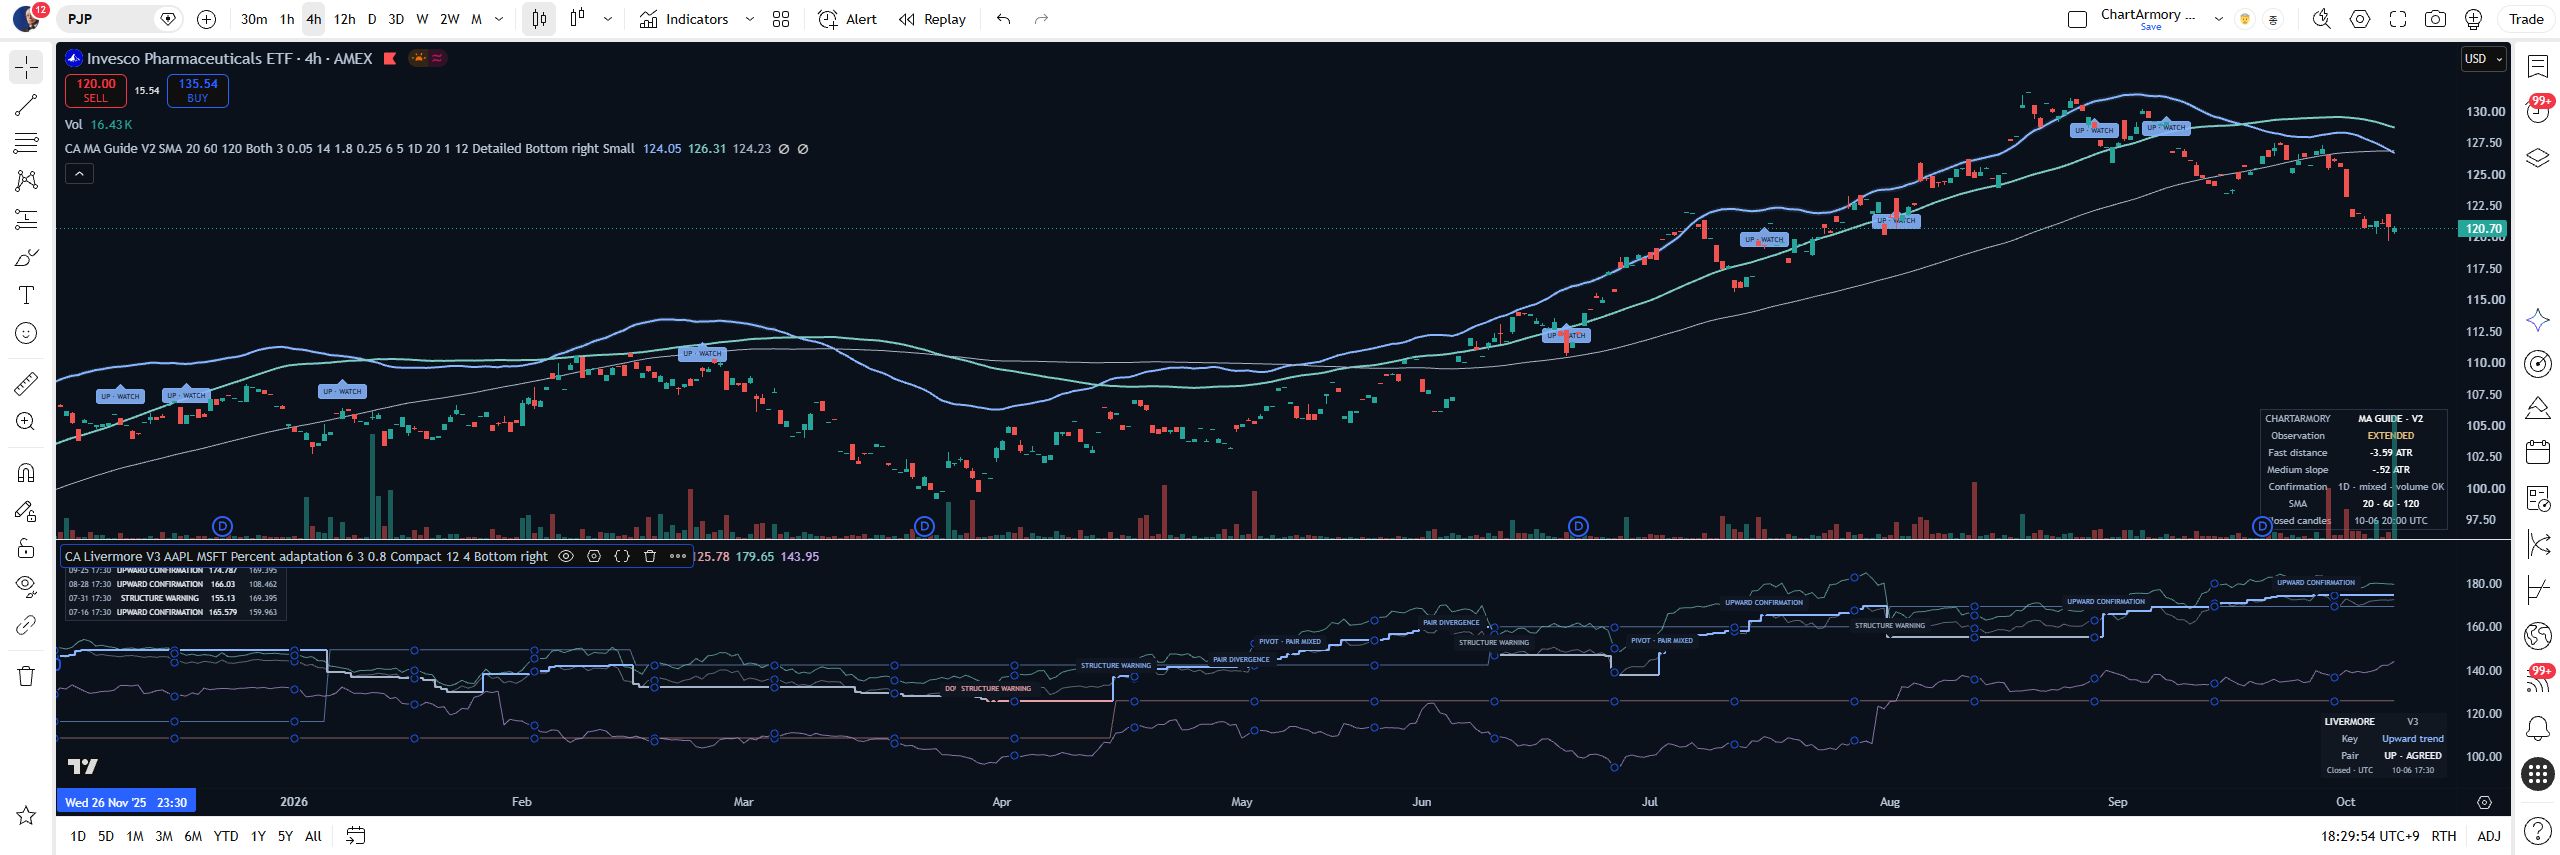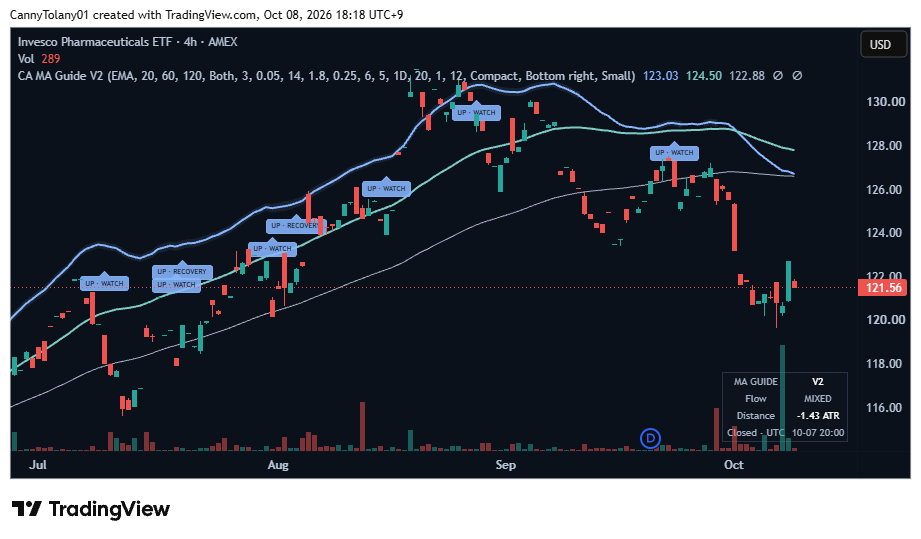
Two classic speeds in one click
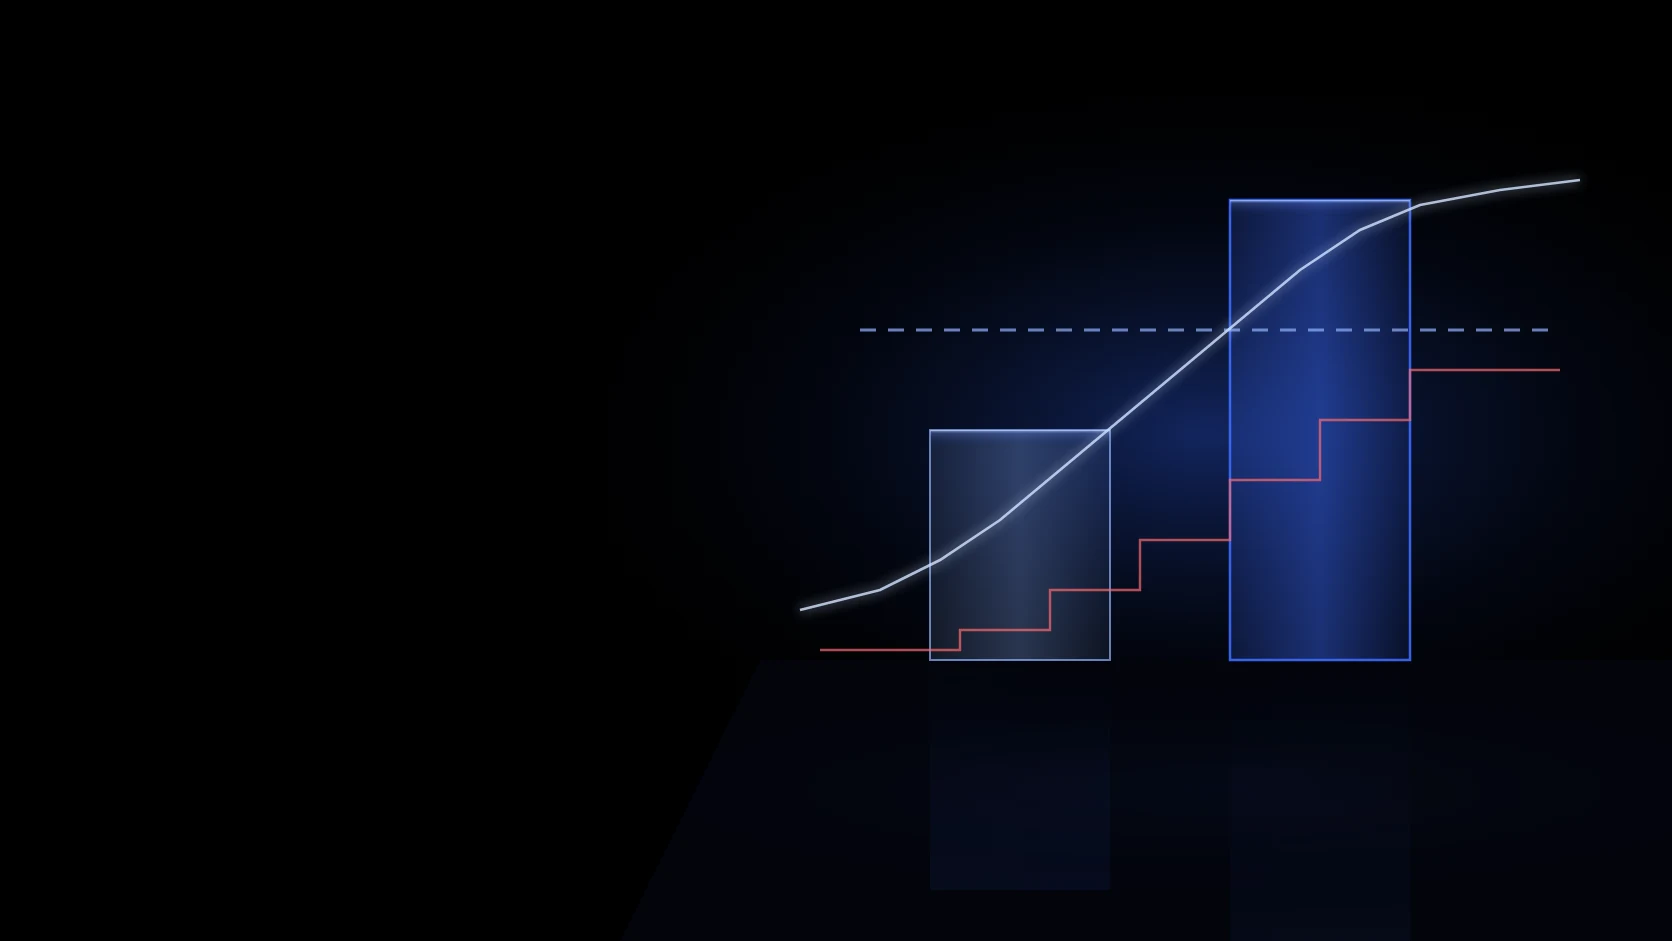
Run the default 55-day high entry and 20-day low exit for patient, big-picture trend trading.
In 1983 and 1984, Richard Dennis taught 23 novices a strict set of breakout rules in just two weeks, and those “Turtles” reportedly earned about $175 million over roughly five years. Now ChartArmory brings those publicly released long-only rules directly to your TradingView charts with the Turtle Breakout indicator.
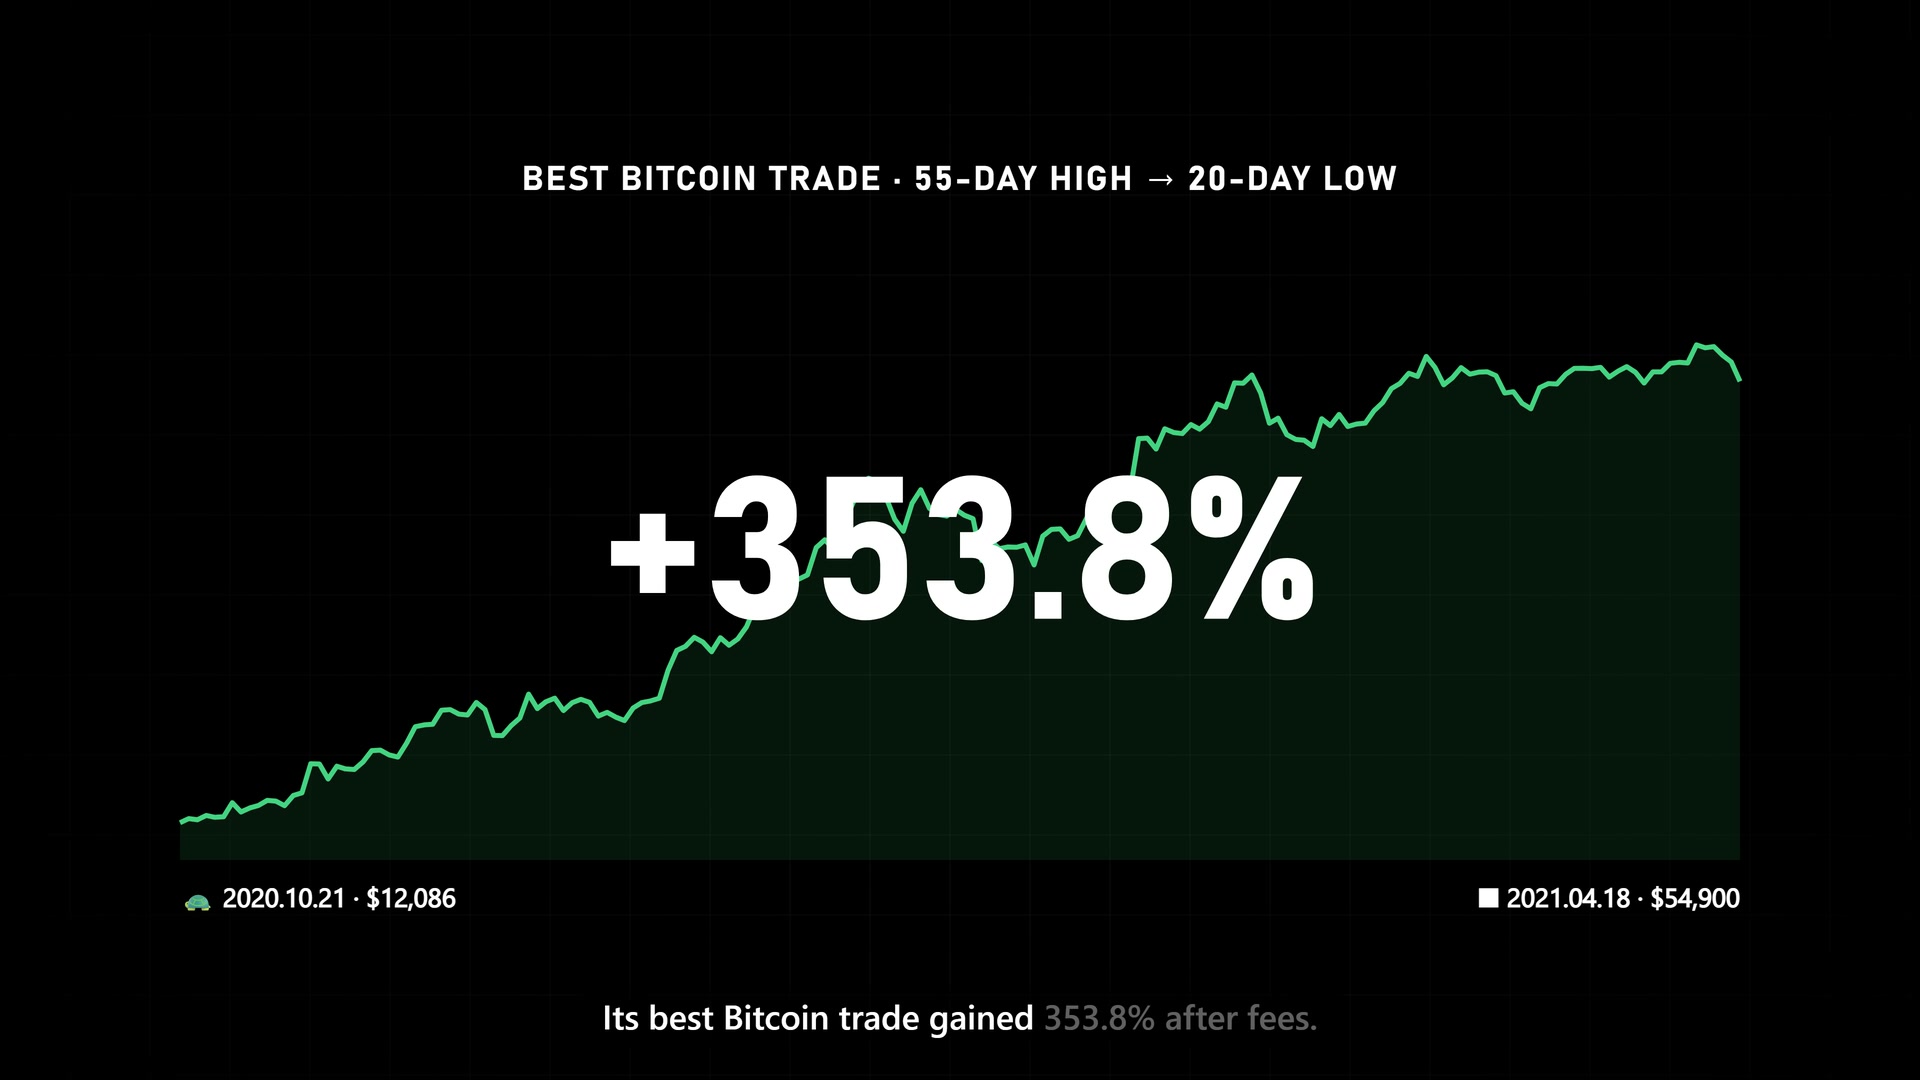
55-day high breakout → exit at the 20-day low · 0.05% fee per buy and per sell included
On the Coinbase Bitcoin daily chart on 21 October 2020, price broke the 55-day high ($12,086.00) and 🐢 marked the entry.
Change = (exit × (1 − 0.05%)) ÷ (entry × (1 + 0.05%)) − 1.
Download the case data (JSON)“Is it real this time?” Fooled by fake breakouts, stuck at the top again
The moment price clears the 55-day high, a 🐢 entry mark appears
Drunk on profit, no idea when to sell, and you give it all back
The moment the 20-day low breaks, a clean exit mark closes the trade
Punching the volatility (N) calculator on every entry
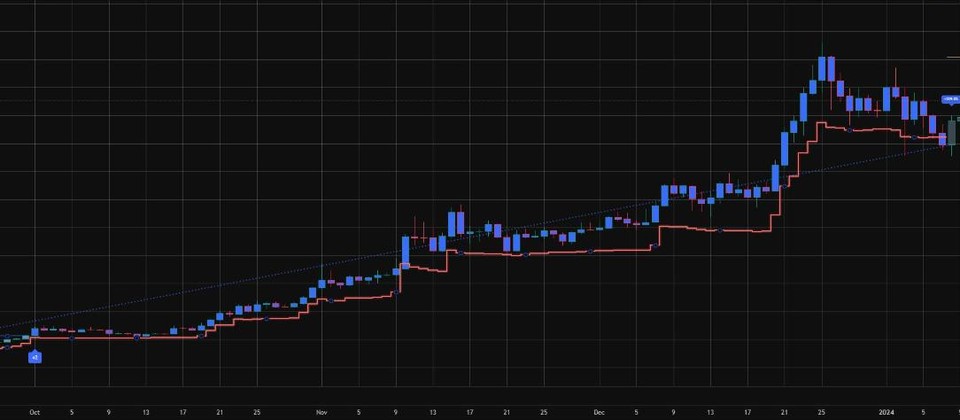
Right after you buy, the “entry − 2N” lifeline is drawn for you
Run the default 55-day high entry and 20-day low exit for patient, big-picture trend trading.
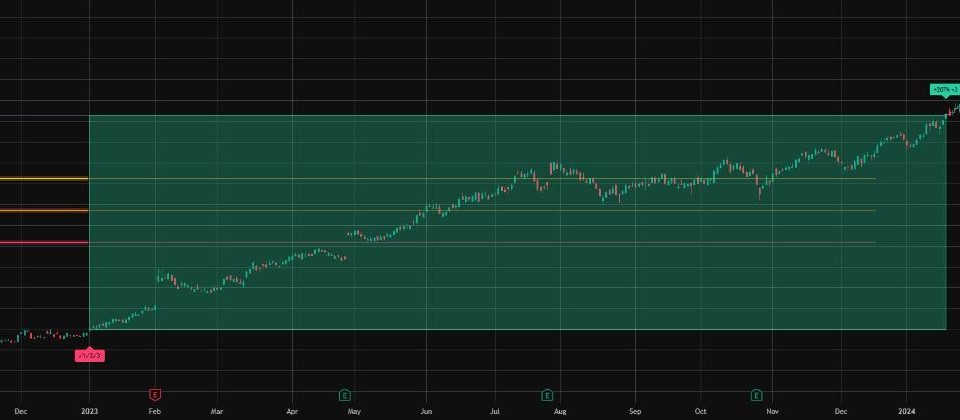
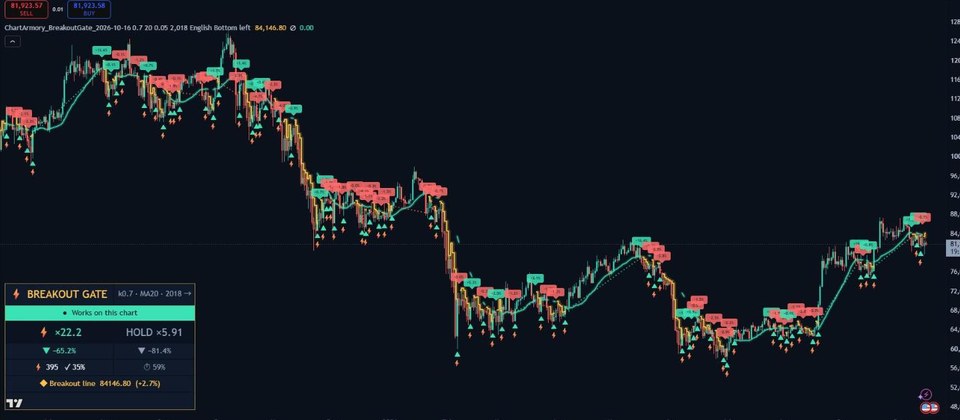
Forget squinting at messy lines: your chart plots the breakout channel, a turtle mark at every entry, the 2N stop line and a result tag on every exit.
The breakout high, the exit low and N all come from previous candles, so the lines you see on history are the lines that were there at the time.
Tested on 2018–2026 daily data with the default 55/20 rule and a 0.05% fee on every buy and every sell, Turtle Breakout shone on volatile crypto trends: Bitcoin earned +40.8% a year against +22.3% for holding, while the deepest drop shrank from −81.4% to −33.9%.
| Market | Turtle Breakout / yr | Buy & hold / yr | Rule deepest drop | Hold deepest drop | Trades |
|---|---|---|---|---|---|
| Bitcoin | +40.8% | +22.3% | −33.9% | −81.4% | 30 |
| Ethereum | +29.5% | +14.3% | −67.4% | −94.0% | 31 |
| Solana | +68.7% | +19.7% | −56.7% | −96.3% | 19 |
| Tesla | +22.5% | +38.1% | −37.8% | −73.6% | 23 |
| NVIDIA | +21.4% | +53.7% | −38.2% | −66.4% | 31 |
| Nasdaq Composite | +7.4% | +16.3% | −19.7% | −36.4% | 26 |
| S&P 500 | +5.1% | +12.7% | −17.0% | −33.9% | 29 |
| Gold futures | +7.8% | +14.2% | −14.1% | −24.9% | 25 |
Daily 2018–2026 · 0.05% fee on each buy and sell
Bitcoin’s deepest drop: Eyes shut and praying −81.4% → turtle exit −33.9%
Solana’s deepest drop: Eyes shut and praying −96.3% → turtle exit −56.7%
The defaults work as delivered. Switch between 55/20 and 20/10, change the stop multiple, fee, start year and panel language in settings.
Past performance does not guarantee future results.
An independently coded tool built on the publicly released Turtle trading rules, with ChartArmory’s own chart display and scorecard. Not affiliated with or endorsed by Richard Dennis, William Eckhardt or any Turtle trader.
No. The breakout high, exit low and N come strictly from previous candles. The 🐢 entry can appear during a live candle once its high passes the line, and it does not disappear afterwards.
No, Turtle Breakout is long only. It buys breakouts above the 55-day high (or the 20-day high in the short-term version) and exits on the 20-day low (or the 10-day low), or at the fixed entry-minus-2N stop.
You can edit it for personal use. Sharing, redistribution and resale rights are not included.
Skip the monthly subscriptions. For a one-time US$59 you get the Turtle Breakout indicator, the full Pine Script v6 source code with a personal-use editing license (no redistribution or resale), an 8-language scorecard and install guide, and 30-day bug support from ChartArmory.
Delivery & refund policy ↗TOP WARNING
CRASH BUYING
POSITION SIZING
VOLATILITY BREAKOUT
LONG-TERM TREND
REBOUND OBSERVATION
BREAKOUT OBSERVATION
LIVERMORE · V3
TREND OBSERVATION
TradingView