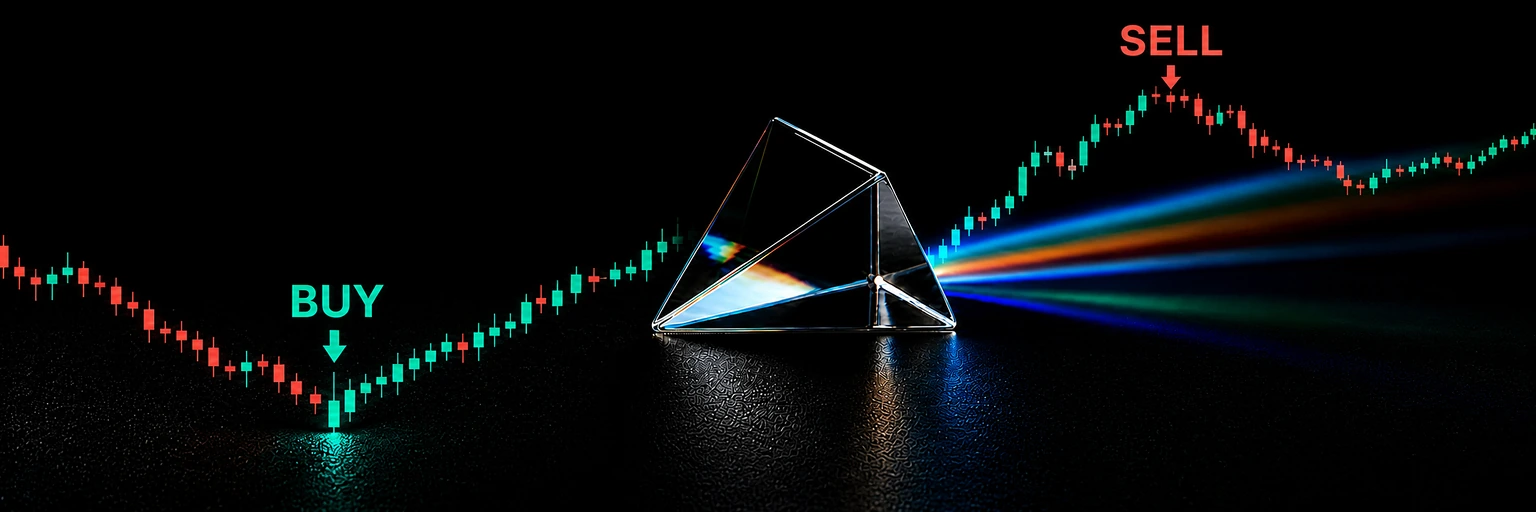
BEFORE · Without indicatorAFTER · Indicator applied
NVDA daily price-change illustration between two fixed dates, 31 Oct 2023–8 Feb 2024. It is not a replay of current indicator signals or verified trading profit. Fees, slippage and taxes are excluded. Past price changes do not guarantee future returns.
I start with the charts that triggered an alert
During market hours, I open the symbols that sent an alert first. Since the candidate zone is already marked, I spend less time figuring out where to begin.
Setup was easier than expected
I followed the setup guide step by step and added it to TradingView right away. Even as a first-time user, I barely got stuck.
Setup was simple, and the chart stayed clean
I expected another indicator to make my chart feel crowded, but it stayed surprisingly clean. I check the BUY or SELL candidate first, then the trend and nearby price action. After a few sessions, that order started to feel natural.
The key zones stand out first
I used to scan the whole chart from the start. With BUY and SELL candidates marked, I now find the zones worth checking much faster.
My chart-review process is clearer
I now check the signal first and then the trend line. The chart feels much less cluttered than when I switched among several indicators.
I use it more for review than for the signal itself
For the first few days, I wanted to react as soon as a label appeared. Now I treat it as a place to start checking, not as an entry command. After a trade, viewing the candidate zone beside the trend change makes it clearer whether I rushed or waited too long. It does not replace my own rules, but my trade notes have become more specific.
I no longer enter on the signal alone
Even when a candidate signal appears, I check the trend direction and the previous zone once more. It gave me a clear pre-entry checklist.
Missed decisions are easier to review
After a trade, reviewing the BUY and SELL zones with the trend shift makes it easier to see where my decision was late. It also helps organize my notes.
Especially useful across multiple markets
I can review candidate zones by the same standard on every market, so switching charts no longer breaks my flow. I can focus on the parts that matter.
The post-alert check is much faster
When an alert arrives, I open the chart and immediately check the candidate signal and current trend. The biggest benefit is no longer wondering what to review first.
Only the essentials, without excess
I worried it might be overloaded with features, but signals and trends are clearly separated. With only the information I need, it became familiar quickly.
I start with the charts that triggered an alert
During market hours, I open the symbols that sent an alert first. Since the candidate zone is already marked, I spend less time figuring out where to begin.
Setup was easier than expected
I followed the setup guide step by step and added it to TradingView right away. Even as a first-time user, I barely got stuck.
Setup was simple, and the chart stayed clean
I expected another indicator to make my chart feel crowded, but it stayed surprisingly clean. I check the BUY or SELL candidate first, then the trend and nearby price action. After a few sessions, that order started to feel natural.
The key zones stand out first
I used to scan the whole chart from the start. With BUY and SELL candidates marked, I now find the zones worth checking much faster.
My chart-review process is clearer
I now check the signal first and then the trend line. The chart feels much less cluttered than when I switched among several indicators.
I use it more for review than for the signal itself
For the first few days, I wanted to react as soon as a label appeared. Now I treat it as a place to start checking, not as an entry command. After a trade, viewing the candidate zone beside the trend change makes it clearer whether I rushed or waited too long. It does not replace my own rules, but my trade notes have become more specific.
I no longer enter on the signal alone
Even when a candidate signal appears, I check the trend direction and the previous zone once more. It gave me a clear pre-entry checklist.
Missed decisions are easier to review
After a trade, reviewing the BUY and SELL zones with the trend shift makes it easier to see where my decision was late. It also helps organize my notes.
Especially useful across multiple markets
I can review candidate zones by the same standard on every market, so switching charts no longer breaks my flow. I can focus on the parts that matter.
The post-alert check is much faster
When an alert arrives, I open the chart and immediately check the candidate signal and current trend. The biggest benefit is no longer wondering what to review first.
Only the essentials, without excess
I worried it might be overloaded with features, but signals and trends are clearly separated. With only the information I need, it became familiar quickly.
An easier investing experience, with ChartArmory.
PRODUCT WORKFLOW
From chart to trade.
01Install
Add the indicator
02Check
Check signals
03Trade
Execute your trade
Verified real signals
A standard for investing
UNH1d · Yahoo
BUYSELL
+39.00%
2026-03-30 → 2026-04-29
FILUSDT4h · Binance
BUYSELL
+138.88%
2025-11-04 → 2025-11-08
TSLA1d · Yahoo
BUYSELL
+64.96%
2023-01-06 → 2023-02-07
LINKUSDT4h · Binance
BUYSELL
+77.53%
2021-05-23 → 2021-05-27
SOLUSDT4h · Binance
BUYSELL
+38.76%
2021-05-23 → 2021-05-27
ADAUSDT4h · Binance
BUYSELL
+45.33%
2021-05-13 → 2021-05-16
AMD1d · Yahoo
BUYSELL
+47.42%
2020-06-29 → 2020-07-29
BA1d · Yahoo
BUYSELL
+49.57%
2020-05-14 → 2020-06-15
TSLA1d · Yahoo
BUYSELL
+67.05%
2020-03-19 → 2020-04-20
CVX1d · Yahoo
BUYSELL
+38.69%
2020-03-19 → 2020-04-20
NFLX1d · Yahoo
BUYSELL
+44.35%
2020-03-17 → 2020-04-16
NVDA1d · Yahoo
BUYSELL
+43.31%
2020-03-17 → 2020-04-16
UNH1d · Yahoo
BUYSELL
+39.00%
2026-03-30 → 2026-04-29
FILUSDT4h · Binance
BUYSELL
+138.88%
2025-11-04 → 2025-11-08
TSLA1d · Yahoo
BUYSELL
+64.96%
2023-01-06 → 2023-02-07
LINKUSDT4h · Binance
BUYSELL
+77.53%
2021-05-23 → 2021-05-27
SOLUSDT4h · Binance
BUYSELL
+38.76%
2021-05-23 → 2021-05-27
ADAUSDT4h · Binance
BUYSELL
+45.33%
2021-05-13 → 2021-05-16
AMD1d · Yahoo
BUYSELL
+47.42%
2020-06-29 → 2020-07-29
BA1d · Yahoo
BUYSELL
+49.57%
2020-05-14 → 2020-06-15
TSLA1d · Yahoo
BUYSELL
+67.05%
2020-03-19 → 2020-04-20
CVX1d · Yahoo
BUYSELL
+38.69%
2020-03-19 → 2020-04-20
NFLX1d · Yahoo
BUYSELL
+44.35%
2020-03-17 → 2020-04-16
NVDA1d · Yahoo
BUYSELL
+43.31%
2020-03-17 → 2020-04-16
Quick setup
Open the chart, then apply the indicator.
Follow the guide to apply it in three simple steps.
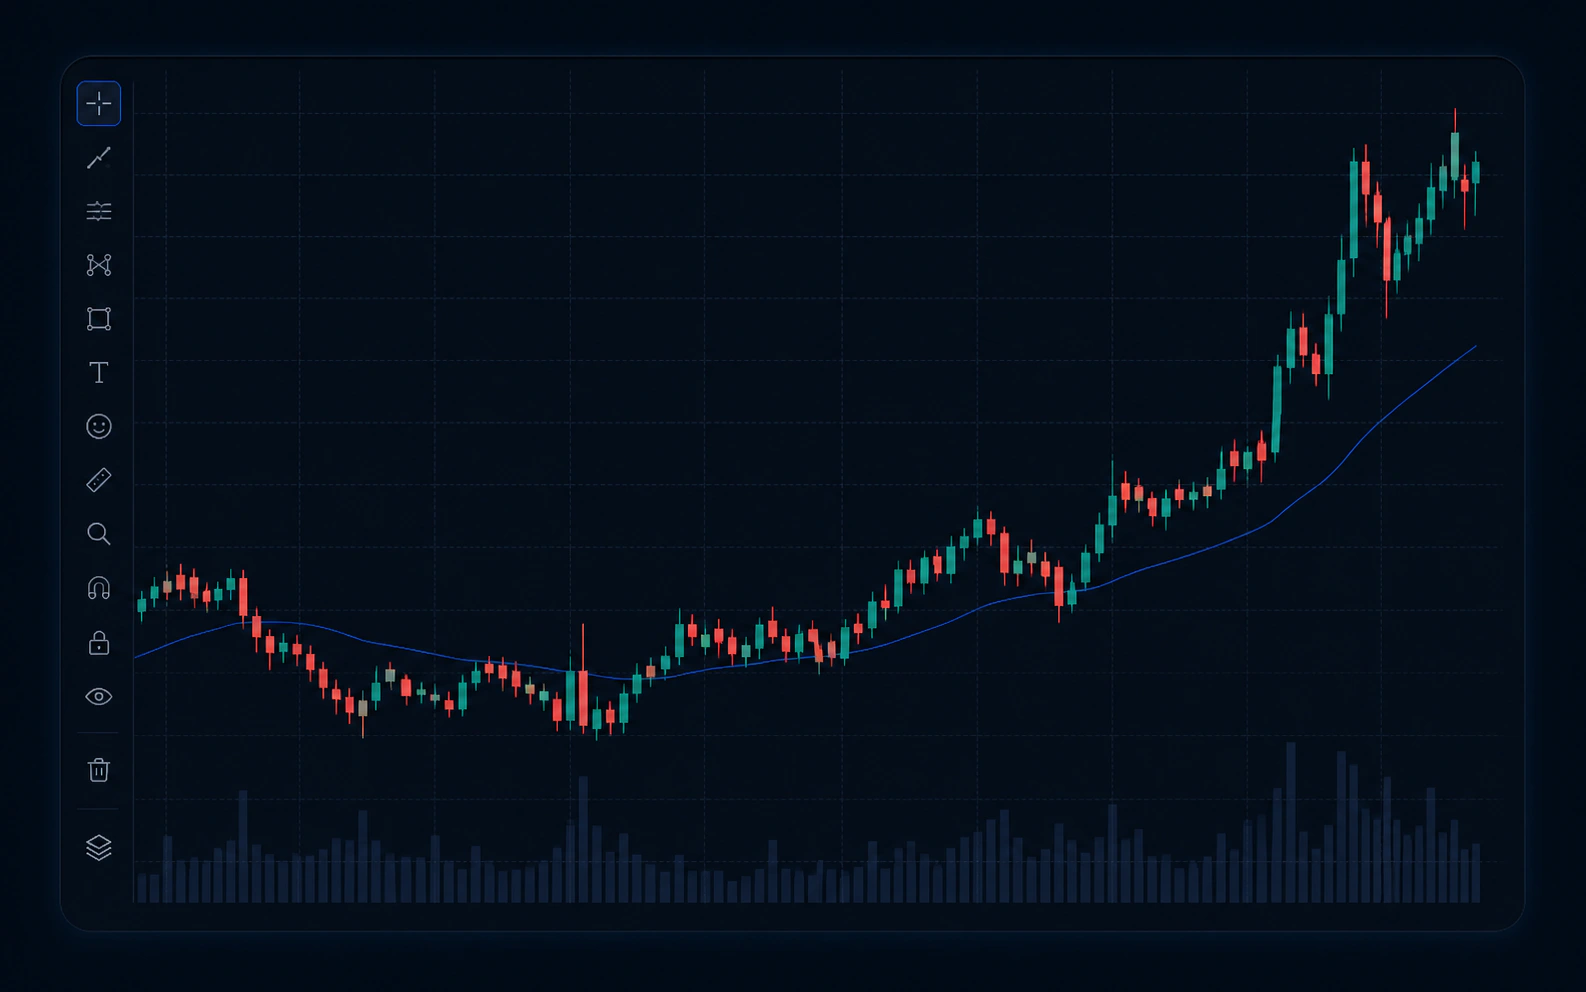
1. Open a TradingView chart
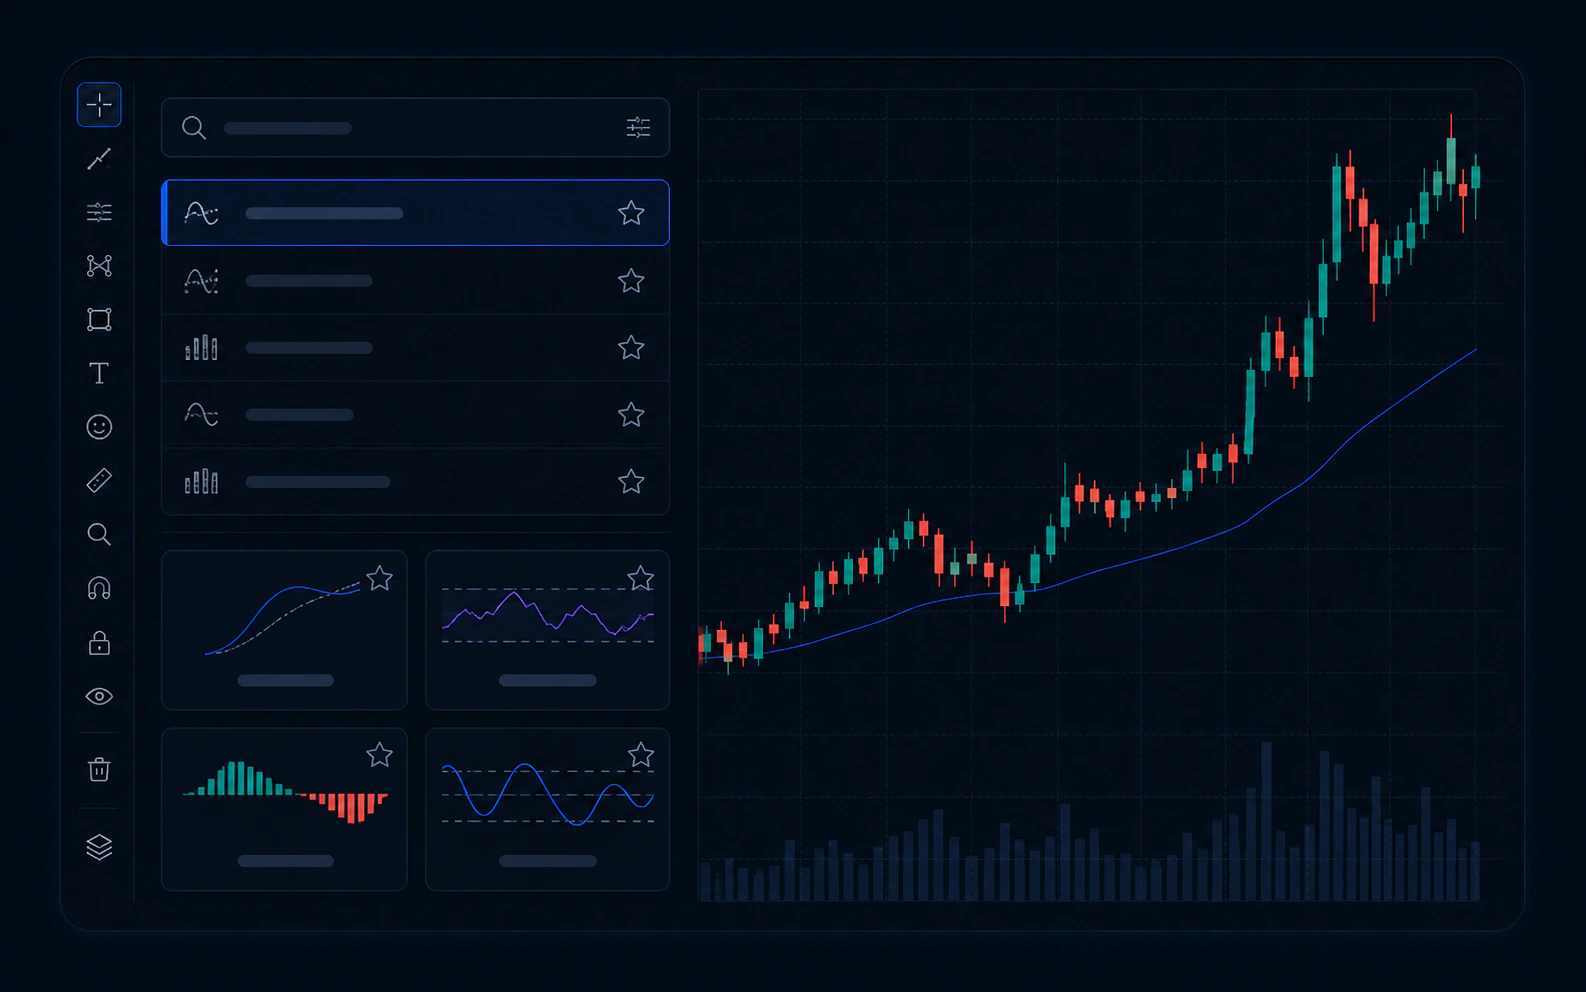
2. Search for EdgeTrend and add it
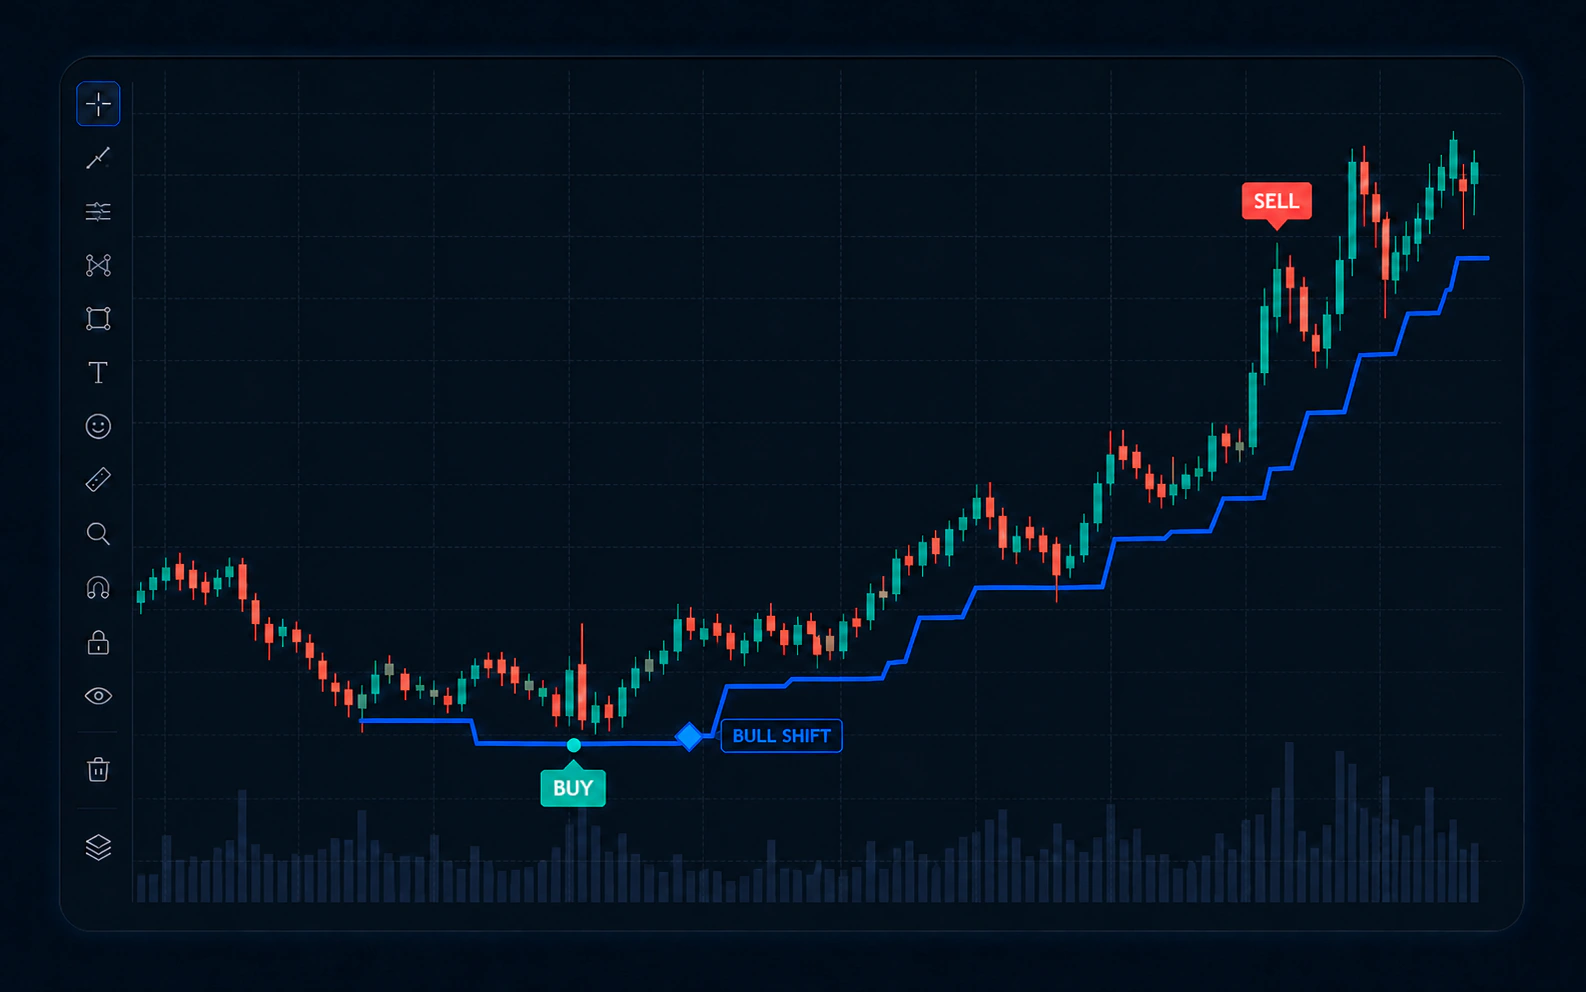
3. Indicator applied
Limited free access
Try EdgeTrend first.
To prevent duplicate grants, we match your requested username with the user who boosted before granting access.
Checking…
CHARTARMORY STUDIO
Indicators that fit your approach
Ready-to-use indicators with full source code
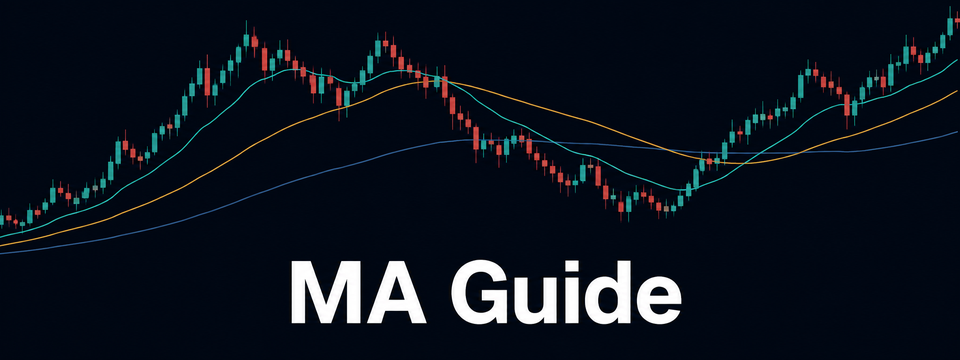
MA GUIDE · V2
MA Guide V2
Set moving averages your way and keep the chart uncluttered. Adjust the settings without editing code.
EdgeTrend marks multi-condition price areas as tiered BUY or SELL candidates and separately displays BULL or BEAR SHIFT after its trend-structure conditions are confirmed.
TradingView invite-onlyLimited free access1 personal account
To prevent duplicate grants, we match your requested username with the user who boosted before granting access. Access remains free until a separate end notice.
SHIFT uses a confirmed pivot and subsequent structure conditions. Its diamond is drawn back at that earlier pivot after confirmation, not at the time the pivot first occurred. A historical diamond therefore does not prove that a trader could have acted on that pivot candle.
Important: EdgeTrend is a chart-analysis aid, not a trade instruction, personalized investment advice, or profit guarantee. Validate it independently before live trading.
 MA GUIDE · V2
 LIVERMORE · V3
 EDGEBREAK · V1