A simple rule that stays in
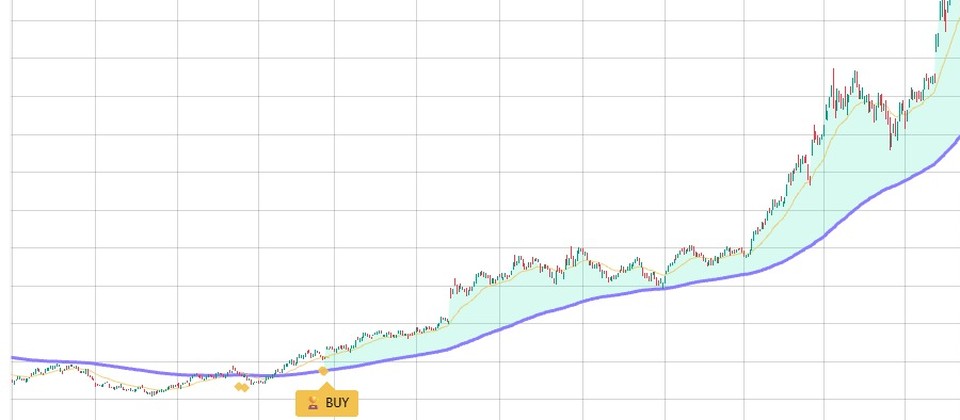
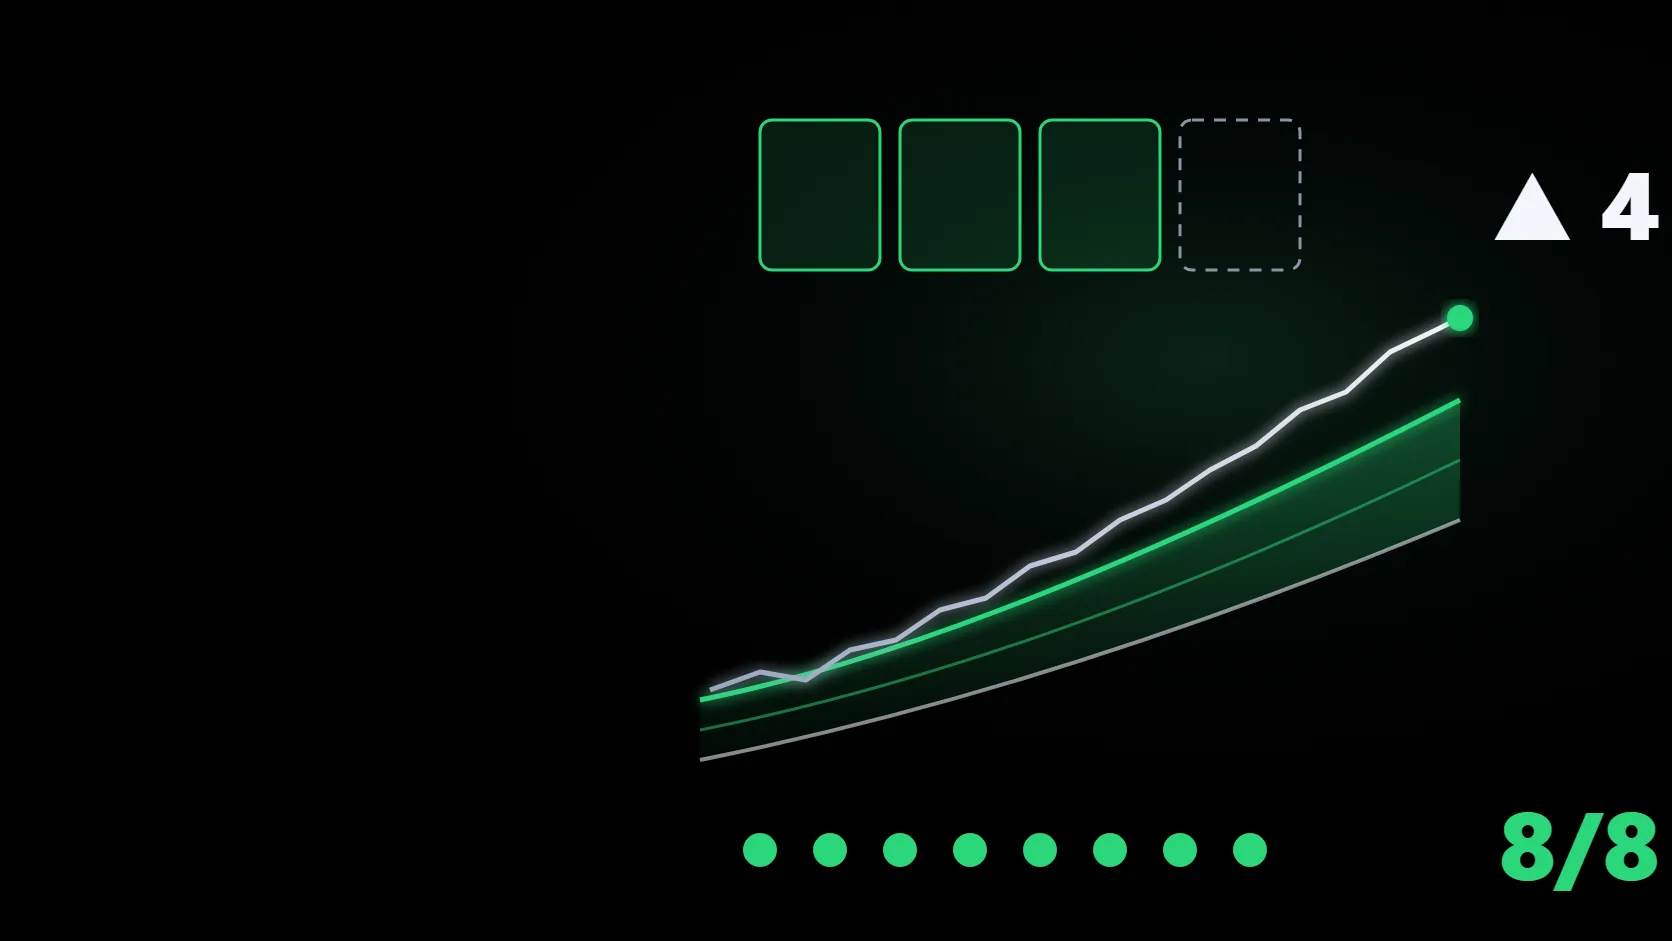
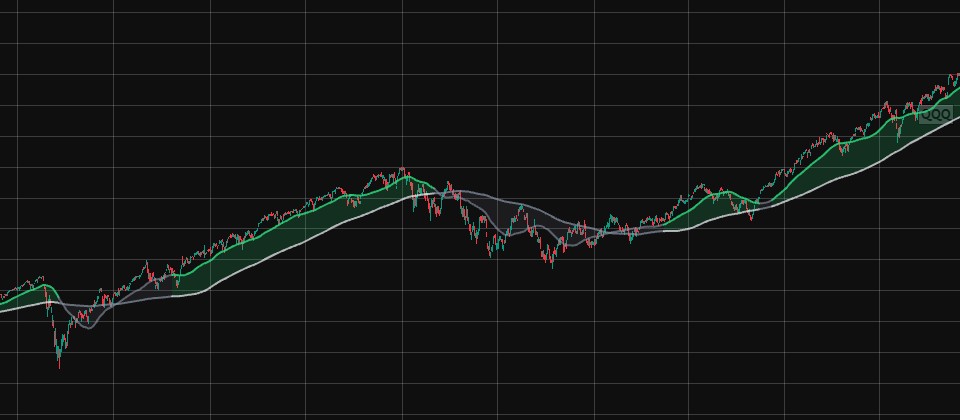
When the fast EMA (15) closes above the slow EMA (150) it is 🔥 BUY; it sells only when it closes back below. Signals are set on the close, so they never repaint.
Built by ChartArmory from the public example of system-trading pioneer Ed Seykota, featured in Market Wizards: a 15/150 EMA cross with ATR-based heat sizing.
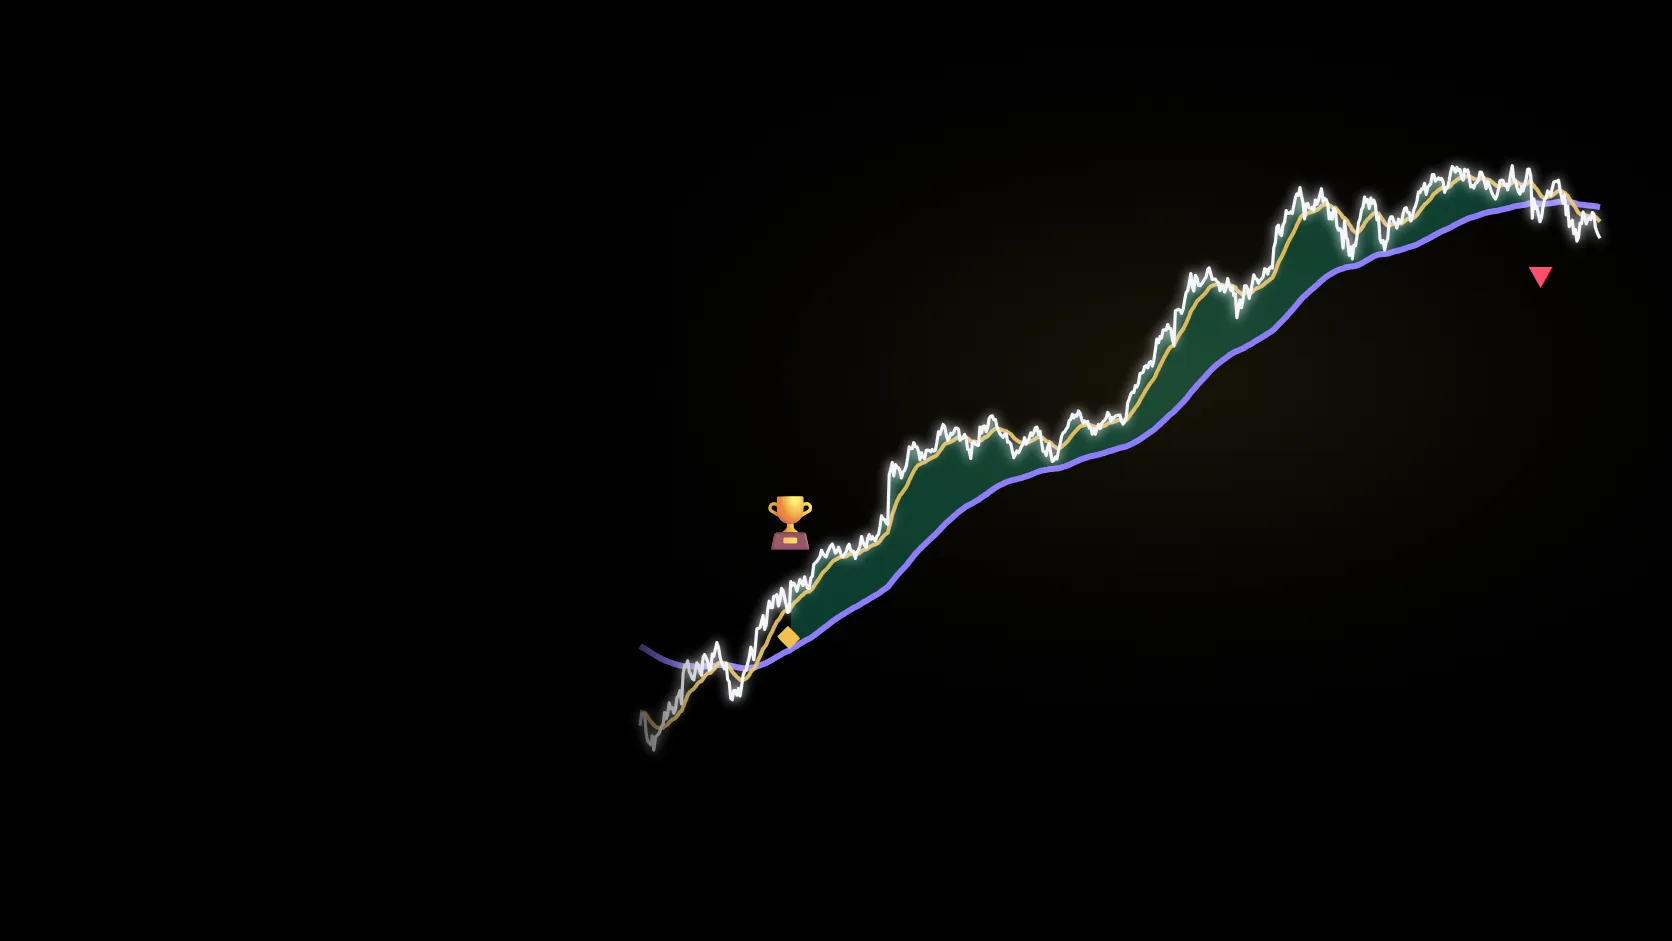
Bought the day the 15-day line closed above the 150-day line, sold the day it closed back below. SPY made +29.8% over the same period.
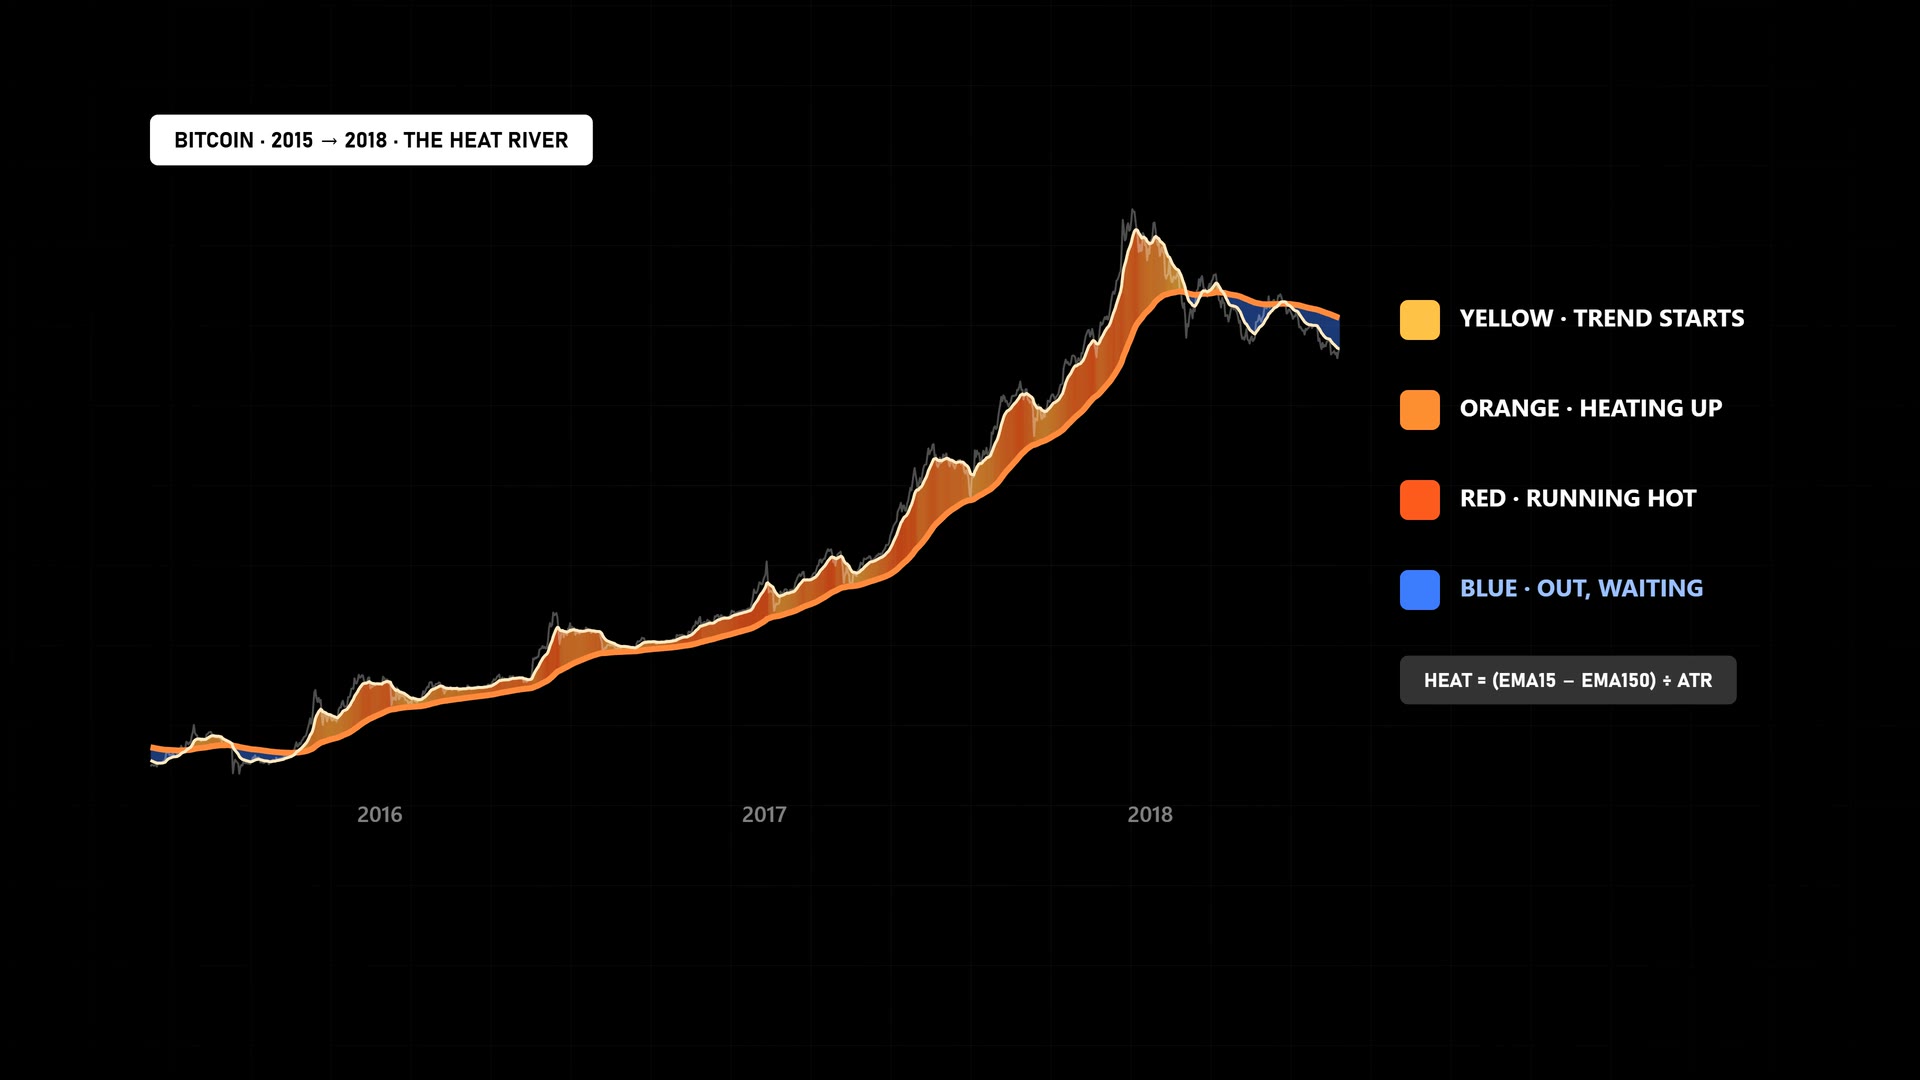
On 17 Oct 2015 the buy signal locked in at the $270.64 close. It kept waiting by the rule even after a peak of $19,497, and on 5 Feb 2018 the 15-day line closed below the 150-day line and it sold at $6,955.27.
Signal and fill at that day's close, 0.1% cost on buy and sell · a replay of the same rule as the TradingView indicator (Yahoo BTC-USD; Bitstamp chart +2,764.9%)
Download the calculation record (JSON) ↓ProblemSelling after a small gain and missing the big trend
FixThere is no other sell condition until the fast line closes below the slow line, so it holds until the trend ends
ProblemNot knowing where to get out, and watching the account halve in a crash
FixA close below the slow line sells and turns the river blue (resting), stepping aside for most of the big falls
ProblemEvery market swings differently, so how much should I buy?
FixFrom account size, heat % and 5 ATR, the card works out the size, the quantity and how much the account shrinks if price falls 5 ATR
When the fast EMA (15) closes above the slow EMA (150) it is 🔥 BUY; it sells only when it closes back below. Signals are set on the close, so they never repaint.
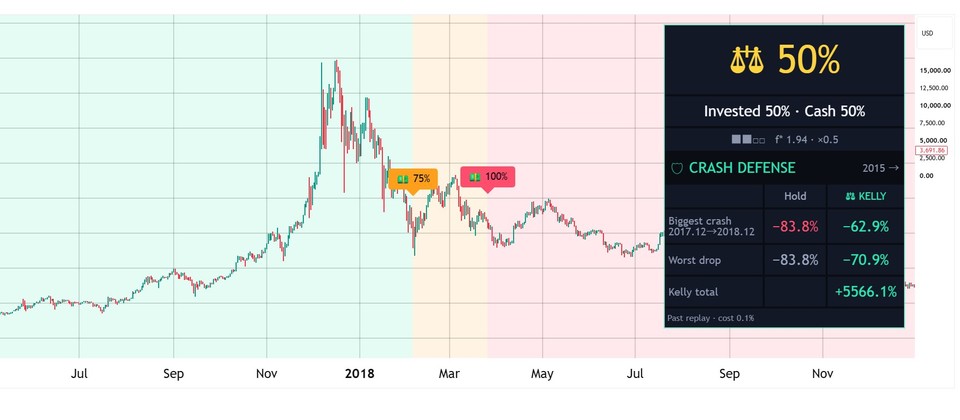
It treats 5× the average range (ATR) as the risk and sizes the position so only a set share of the account (10% by default) is at stake. Calm market, bigger size; wild market, smaller size. Up to 100%, no leverage.
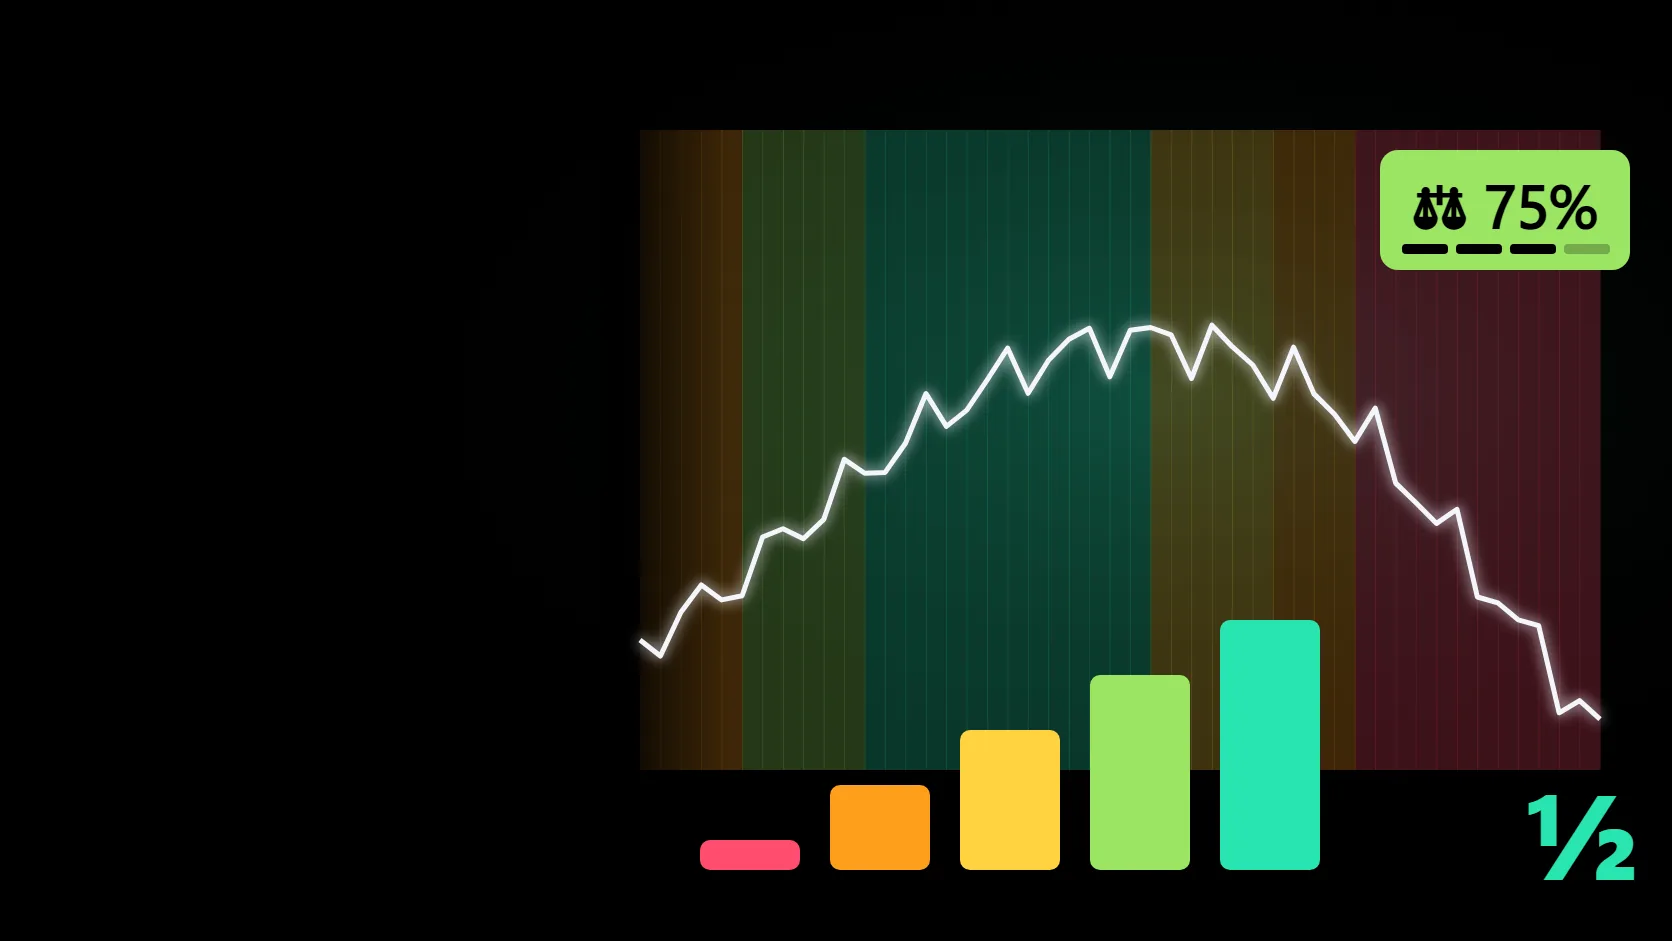
A 'heat river' between the lines that glows yellow, orange and red as the trend strengthens and turns blue while resting, plus an 8-language card with the state, heat size and past crash results, and buy/sell alerts.
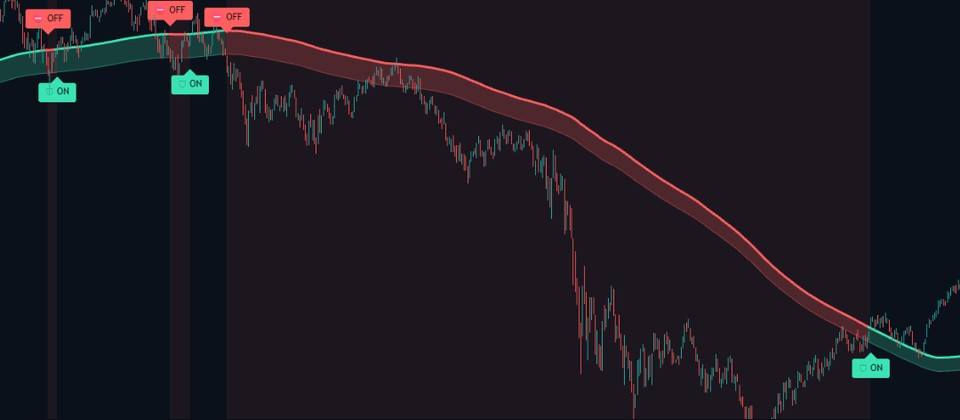
The color of the heat river between the two moving averages and one card tell you at a glance whether you are riding a trend or resting.
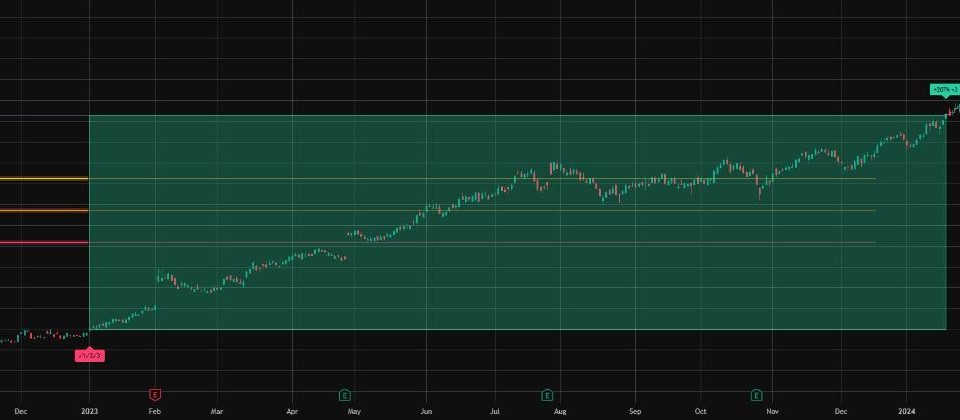
After 🔥 BUY it held along the orange heat river for about 28 months, then sold: +2,764.9% on the Bitstamp chart.
Through the 2007.10–2009.3 crash, when holding lost −56.5%, it was mostly on the blue river (resting), and the card shows −10.5%.
Ten markets, from stocks and indexes to crypto and gold: the worst drop when simply holding versus with Trend Heat.
| Market | From | Hold: worst drop | Trend Heat: worst drop |
|---|---|---|---|
| S&P 500 (SPY) | 2001 | −56.5% | −29.3% |
| Nasdaq 100 (QQQ) | 2001 | −70.4% | −29.8% |
| Nvidia | 2001 | −89.7% | −52.3% |
| Tesla | 2011 | −73.6% | −70.3% |
| Apple | 2001 | −60.9% | −43.3% |
| Meta | 2013 | −76.7% | −49.5% |
| Bitcoin | 2015 | −83.4% | −75.5% |
| Ethereum | 2018 | −82.0% | −62.0% |
| Gold | 2001 | −44.4% | −38.2% |
| Microsoft | 2001 | −59.1% | −50.1% |
Historic crashes: simply holding versus Trend Heat (0.1% cost on every buy and sell).
With the indicator −10.5%
2008 crisis S&P 500 (2007.10–2009.3) — holding lost −56.5%. The indicator rested through most of the fall.
With the indicator −31.8%
Dot-com crash Nasdaq 100 (2000.3–2002.10) — holding lost −83.0%. Following the indicator, the loss stopped here.
With the indicator −31.6%
Bitcoin bear market (2021.11–2022.11) — holding lost −76.6%. Following the indicator, the loss stopped here.
No monthly fee: one payment gets you the full Pine Script v6 source to keep and edit.
Past performance does not guarantee future results.
Built by ChartArmory from Ed Seykota's public example; not affiliated with or endorsed by Seykota.
Size = account × heat % (10% by default) ÷ (ATR × 5). It sets the quantity so that a drop of 5 average ranges (ATR) shrinks the account by only the heat %. Up to 100%, no leverage; account size, heat % and the ATR multiple are inputs.
In trendless chop it can buy and sell repeatedly and take several small losses, and in long, nonstop bull runs its total return is often lower than holding.
No. The 15-day and 150-day EMA cross is judged on confirmed closes only, so it never repaints. Long only.
No. ChartArmory built it from the example Seykota published in the Trading System Project on his website; it is not affiliated with or endorsed by him.
Dot-com Nasdaq 100 (2000.3–2002.10) −83.0% → −31.8%, Meta (2021.9–2022.11) −76.7% → −30.7%, Covid crash S&P 500 (2020.2–3) −34.1% → −19.0% (holding → Trend Heat).
You can edit it for personal use. Sharing, redistribution and resale rights are not included.
Put Trend Heat's full source on your TradingView chart today and manage trend and size with numbers instead of nerves.
Breakout step checker
PULLBACK TREND
POSITION SIZER
LEADER ROTATION
TOP WARNING
CRASH BUYING
POSITION SIZING
TREND BREAKOUT
VOLATILITY BREAKOUT
LONG-TERM TREND
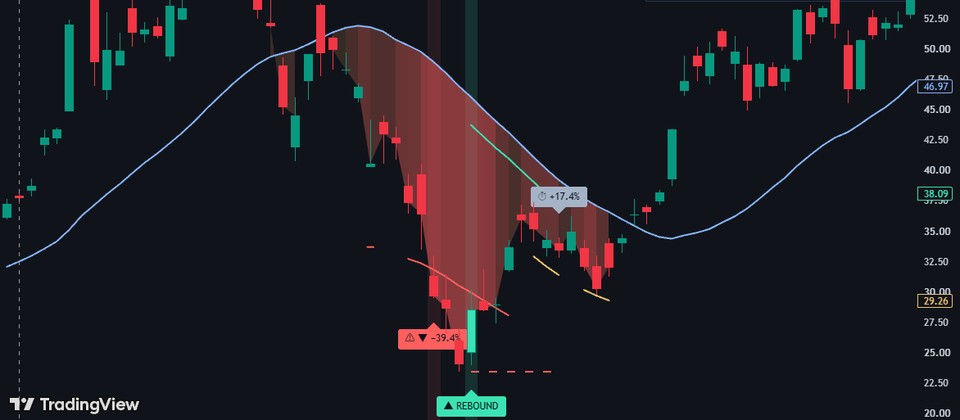
REBOUND OBSERVATION
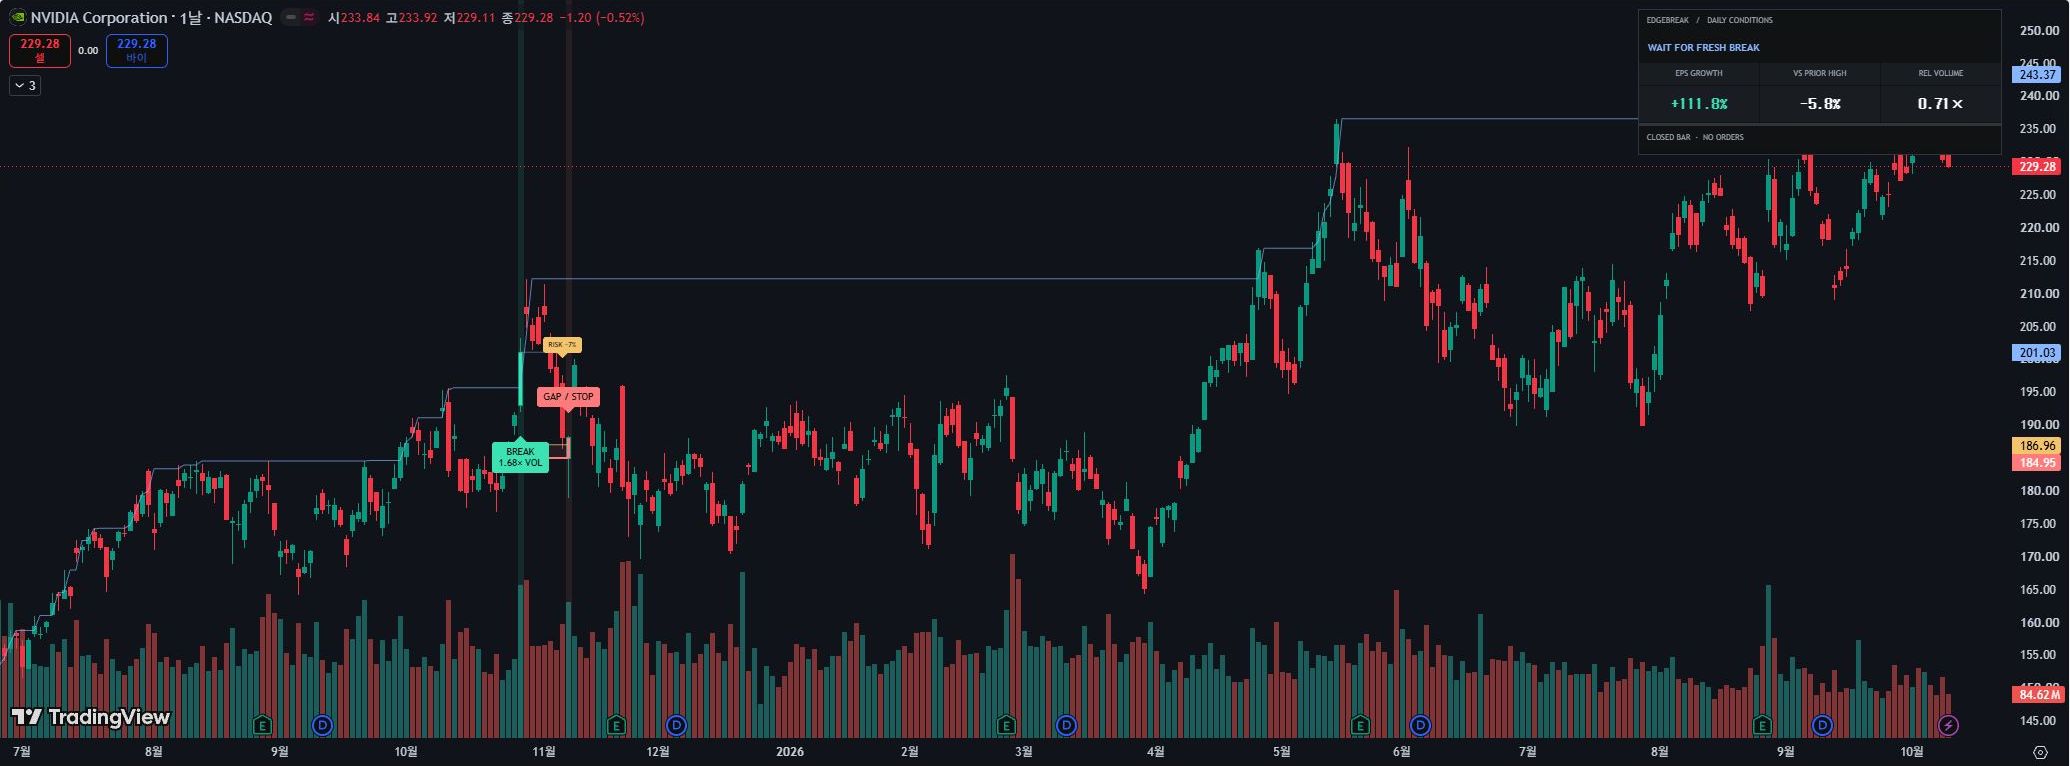
BREAKOUT OBSERVATION
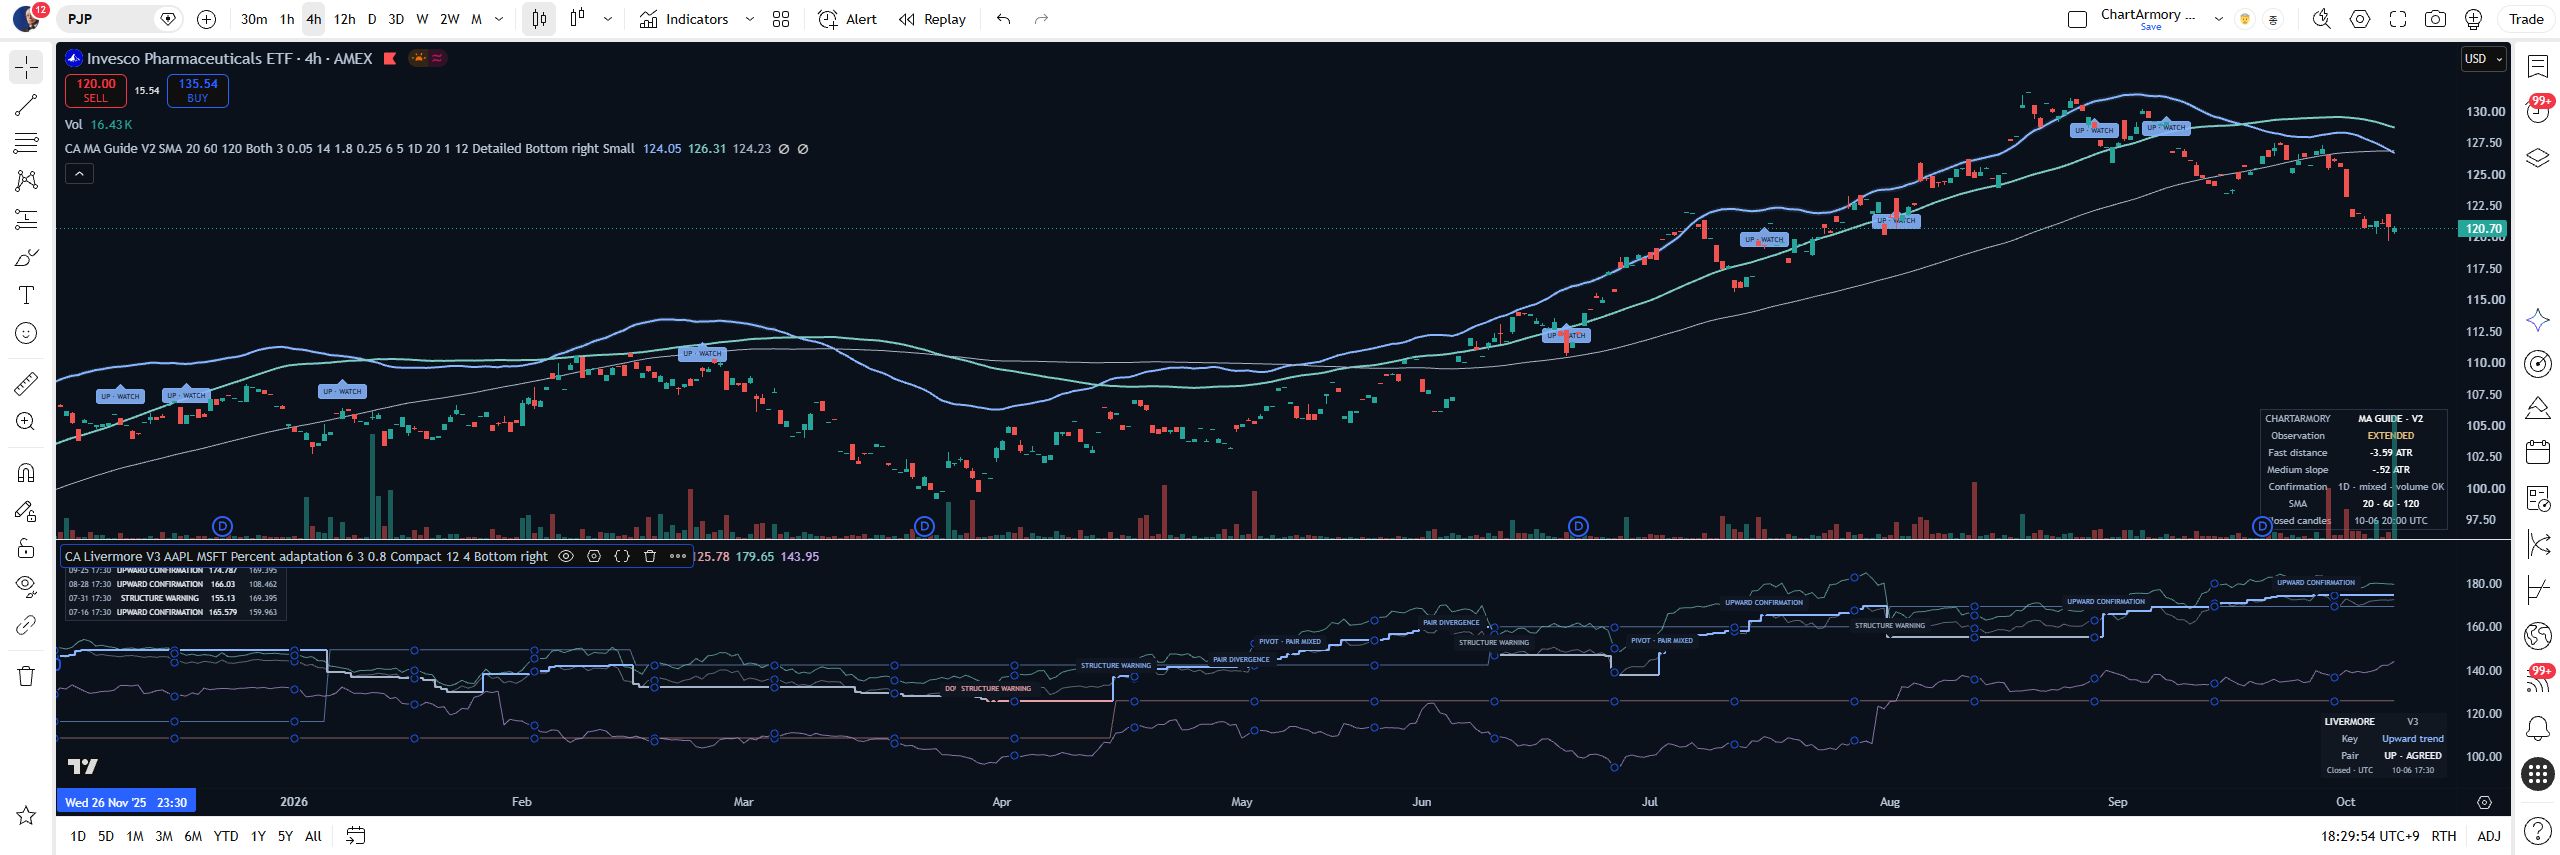
LIVERMORE · V3
TREND OBSERVATION
TradingView