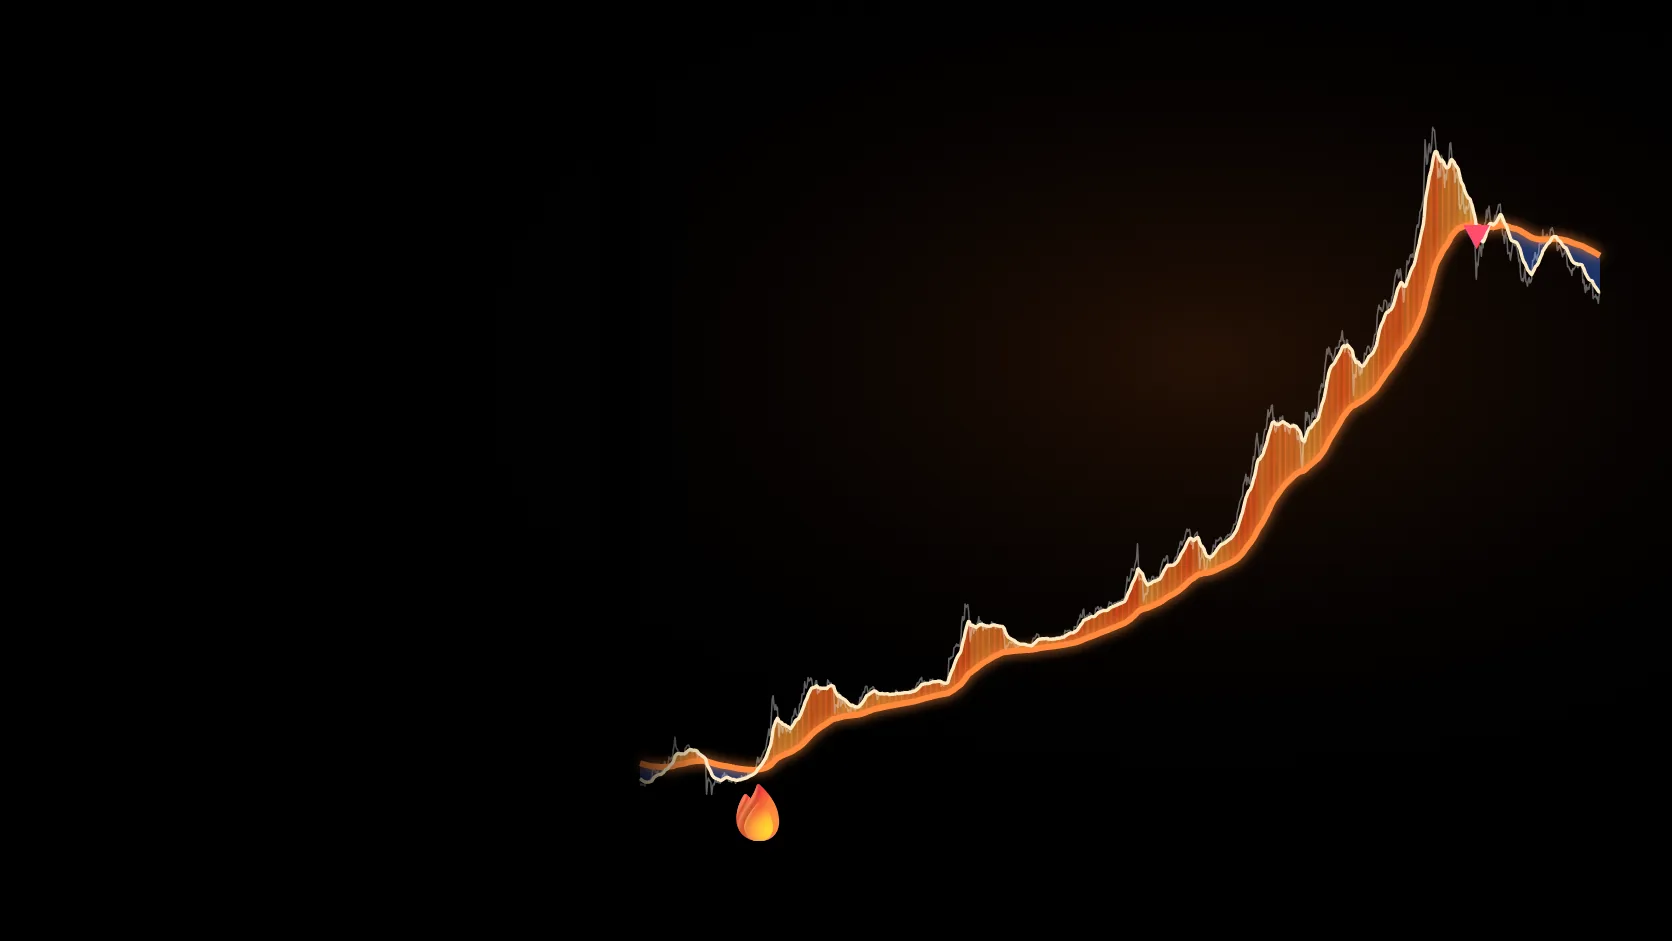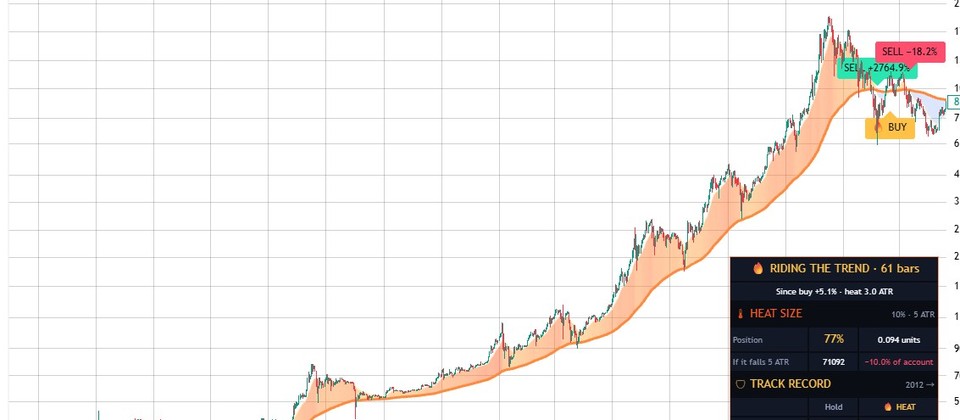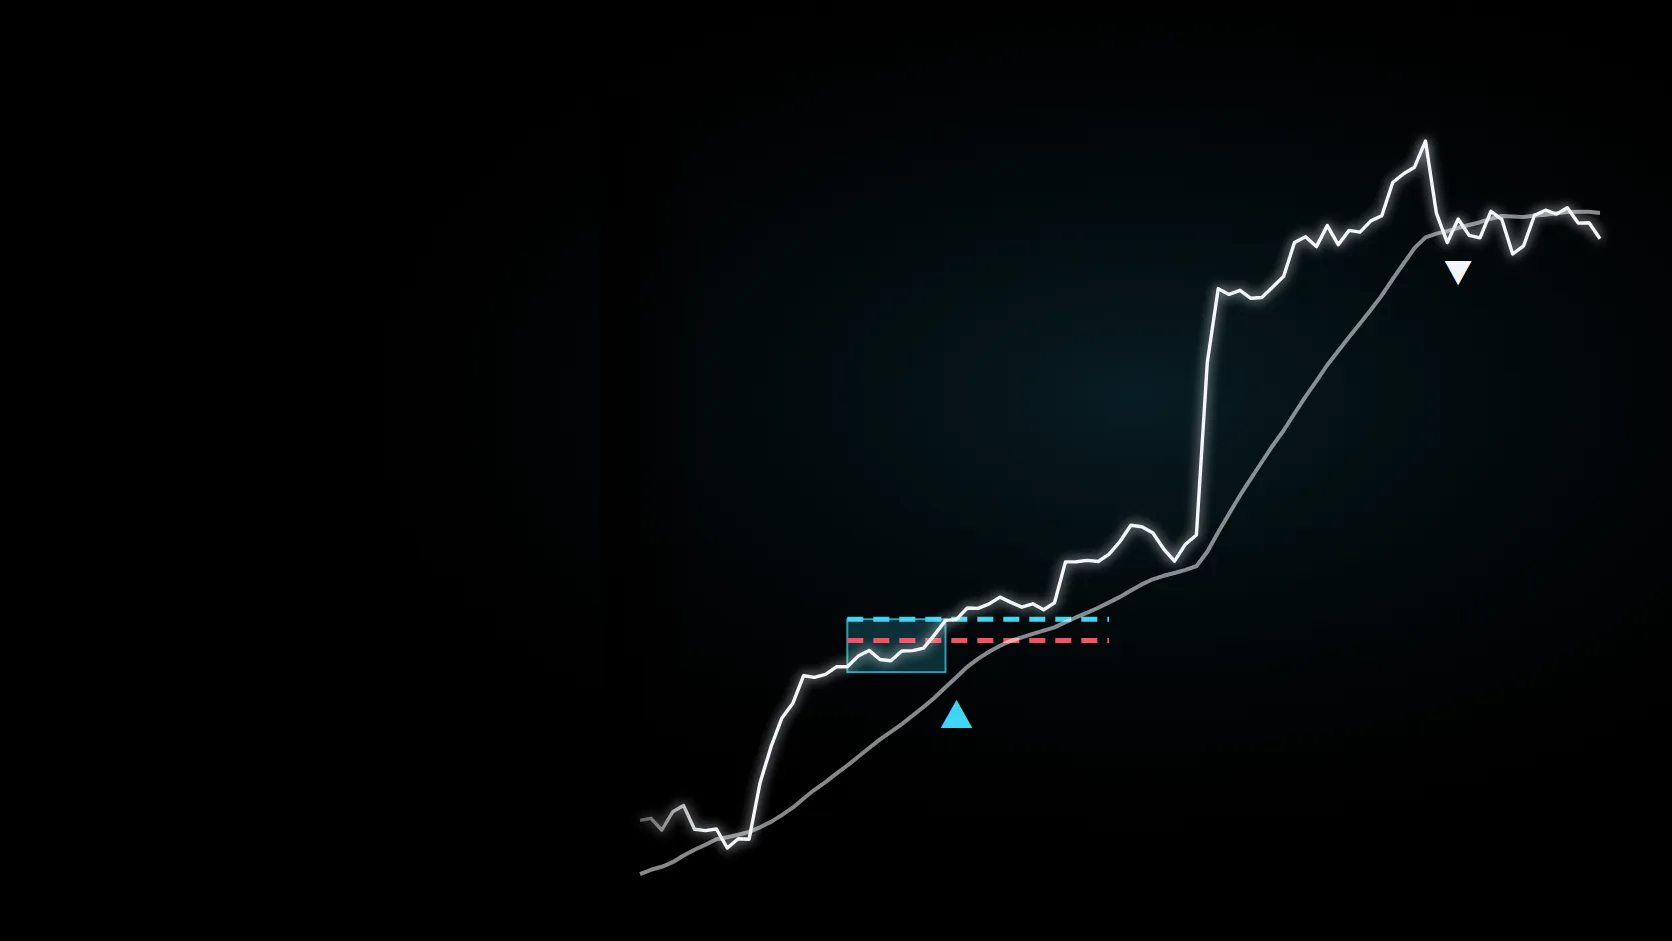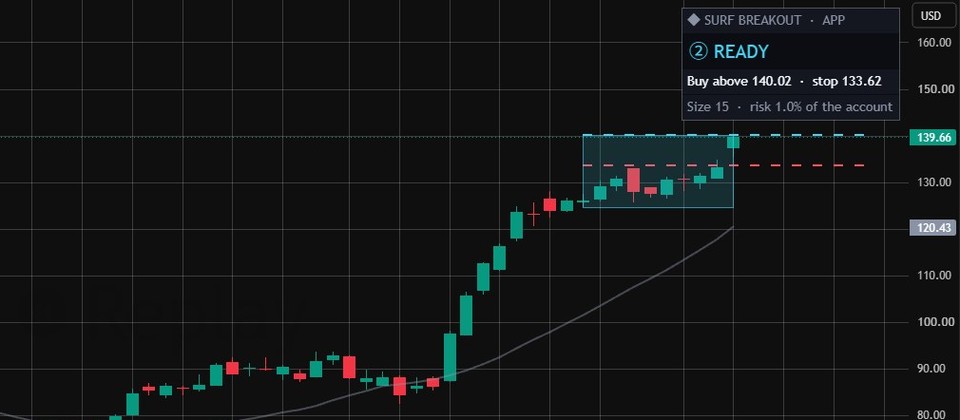
A tide line and dots you read at a glance
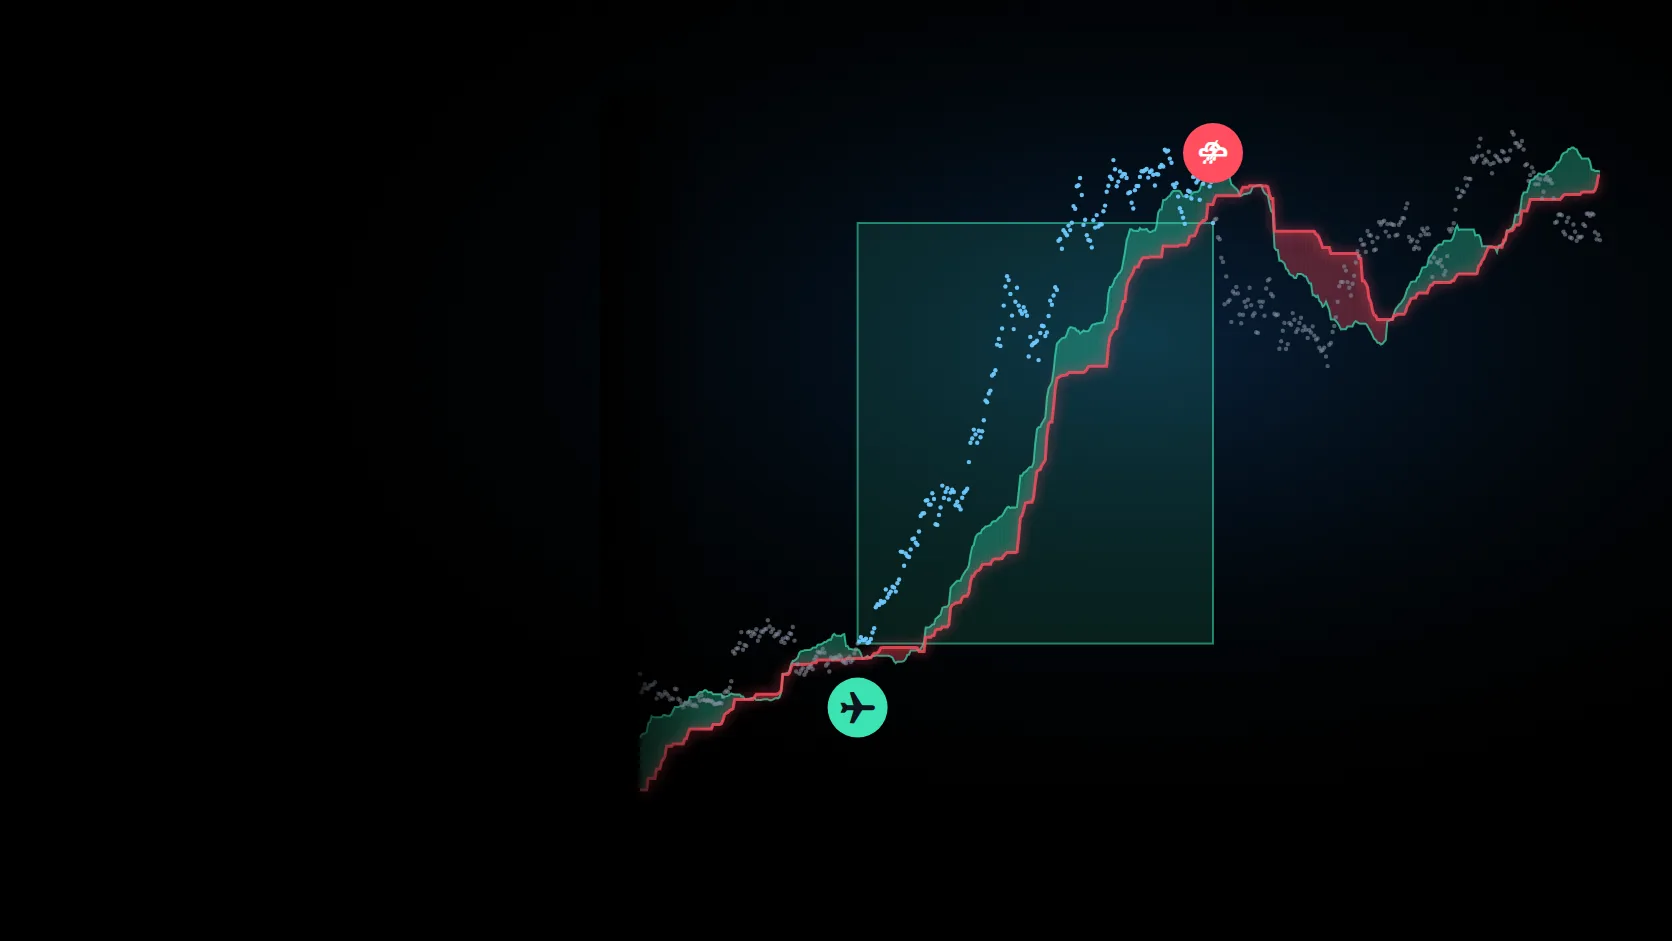
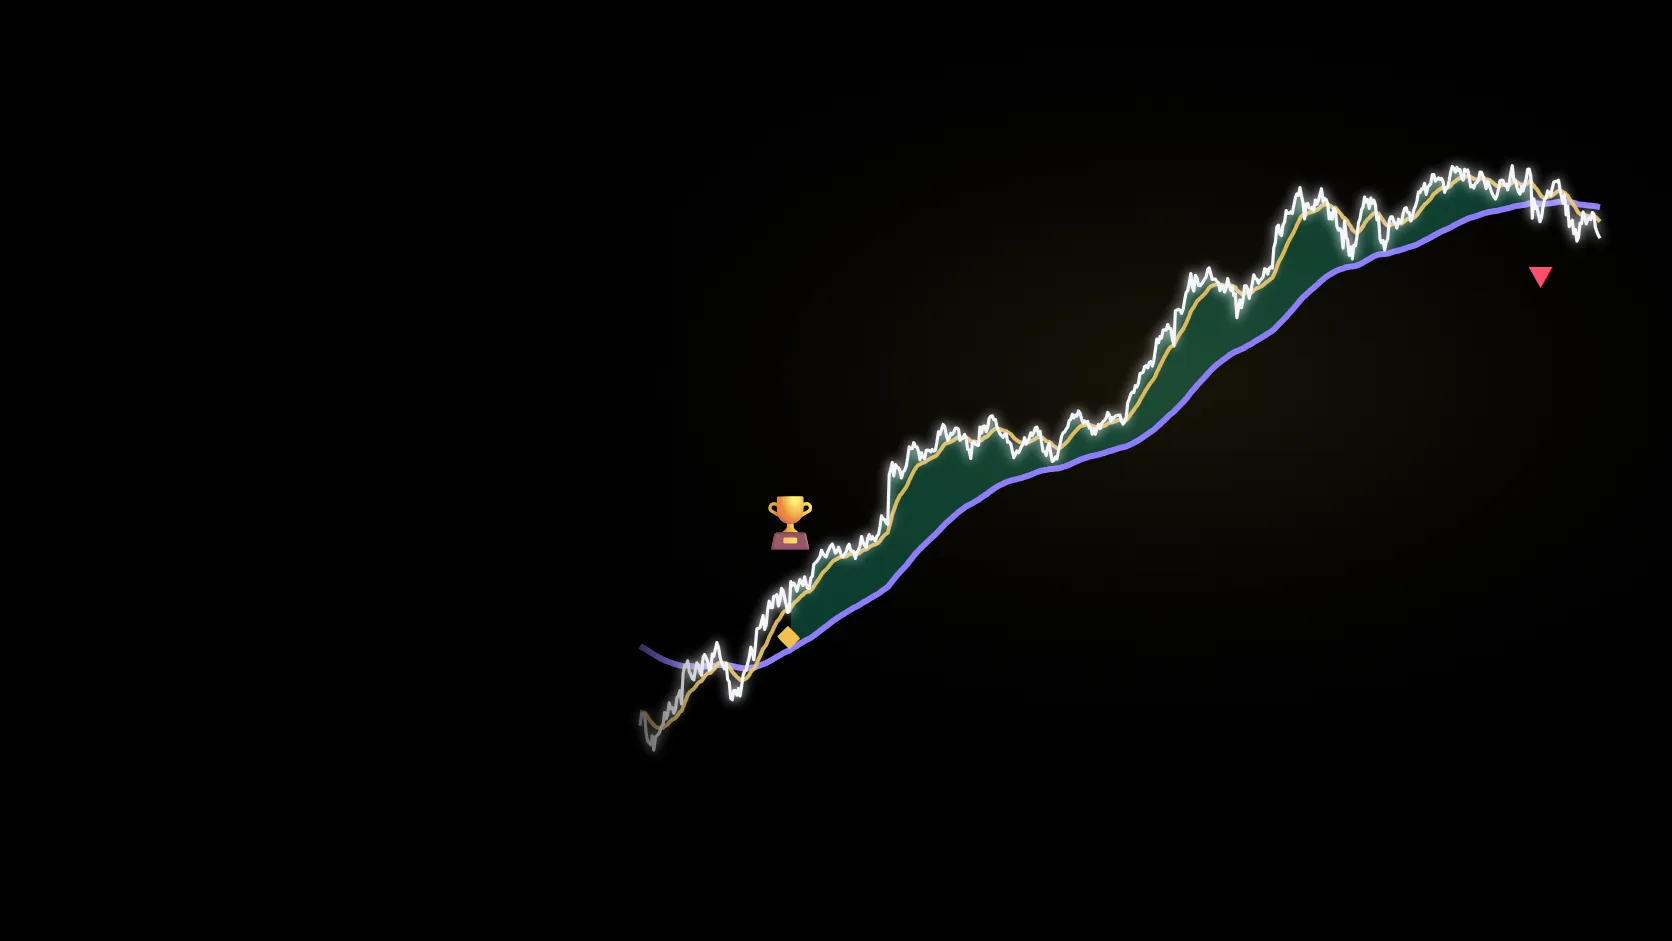
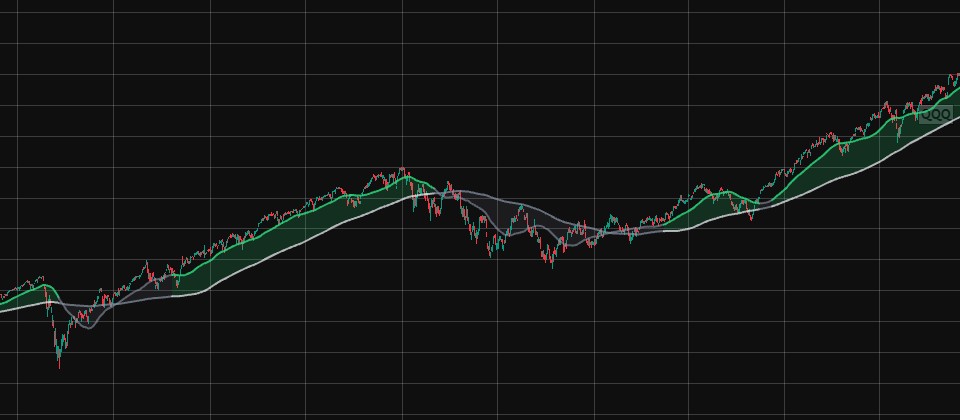
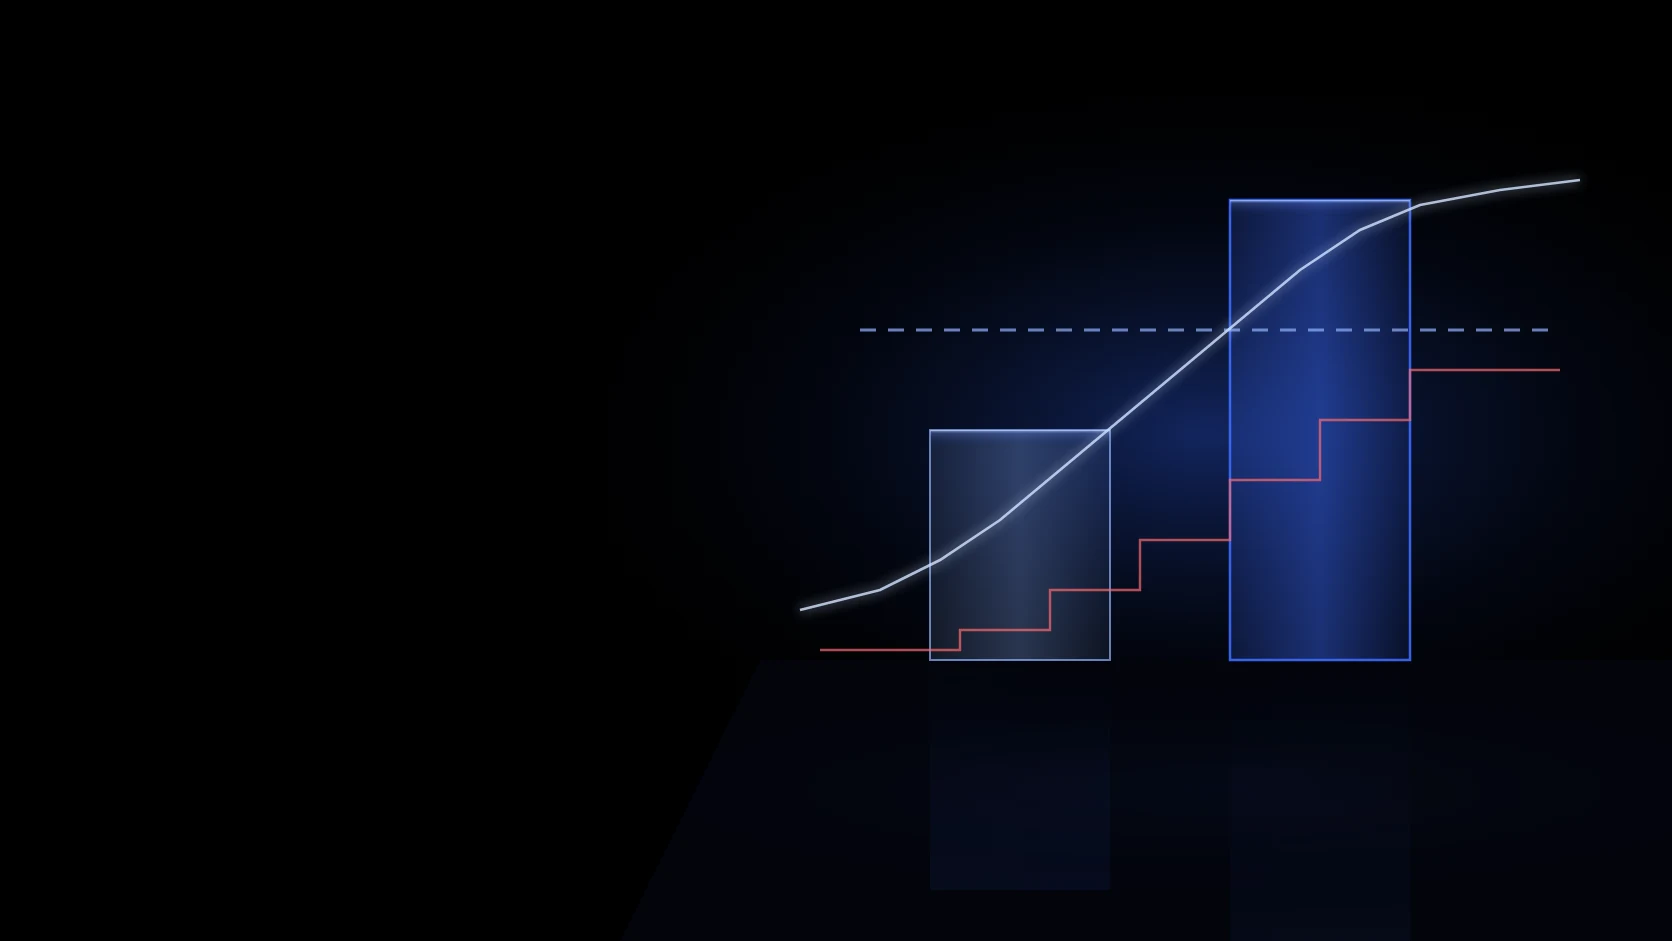
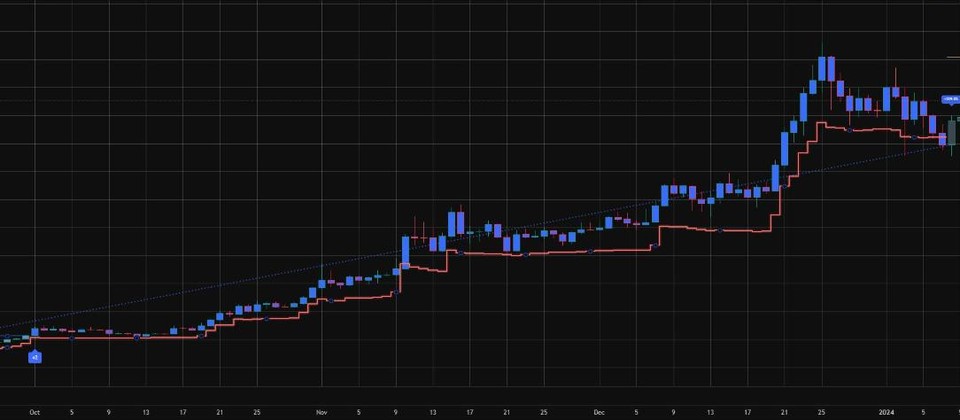
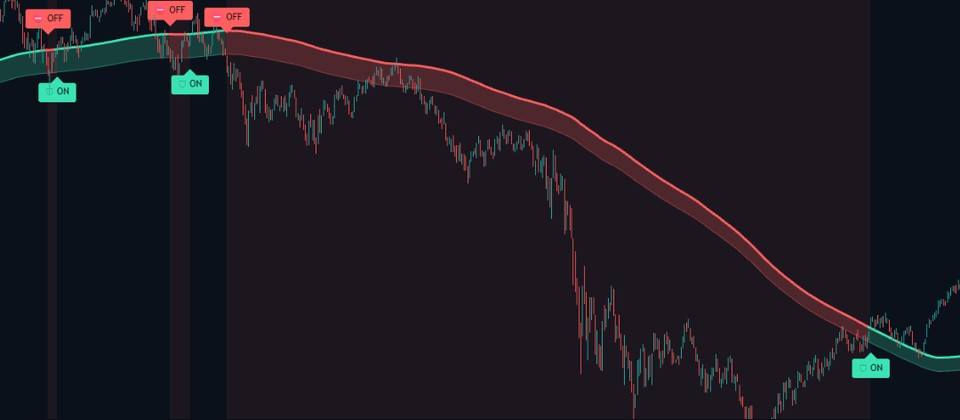
The 50-day tide line turns teal while you hold and coral while you wait in cash, and blue dots under the bars show whether volume (OBV) is backing the move.
ChartArmory's own build of the On-Balance Volume (OBV) idea Joseph Granville popularized in 1963, tuned for daily crypto charts. It tells you just two things: ▲ RIDE (hold) or ▼ OUT (cash).
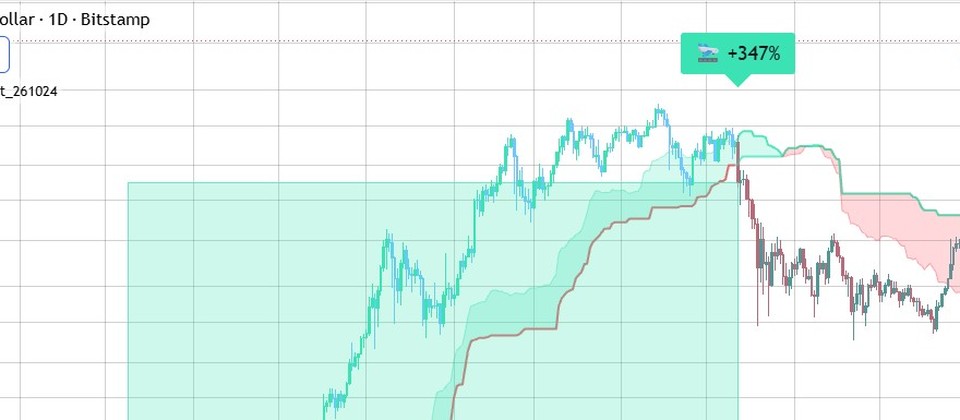
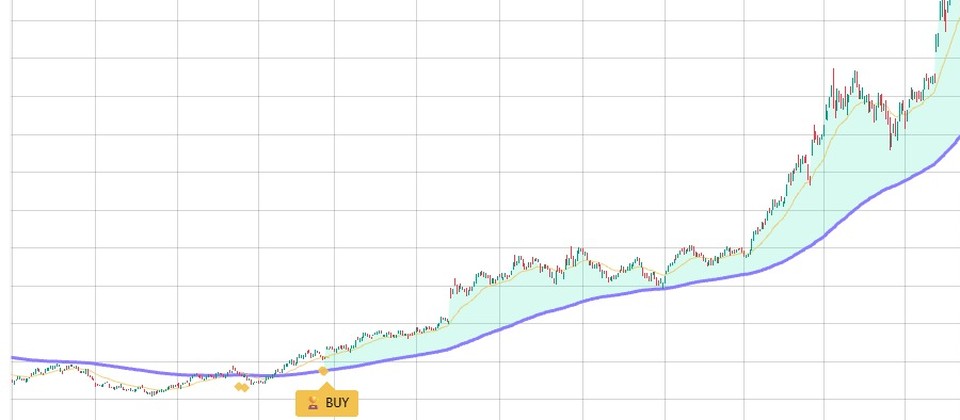
Bought the day after volume and price both rose above their lines, sold the day after one of them broke. It didn't catch the top, but it took the body of the rally.
▲ RIDE was confirmed on the December 12, 2020 close, and it bought at the next open, $568.09. ▼ OUT was confirmed on the February 23, 2021 close, and it sold at the next open, $1,577.79. The highest close in between was $1,955 on February 19.
Signal on the daily close, fill at the next open, 0.1% cost per buy and sell · a replay of the TradingView indicator's rule (Binance ETHUSDT daily; other exchanges' charts can differ slightly)
Download the record used for this (JSON) ↓Drag the handle to compare the chart with and without Volume Tide.
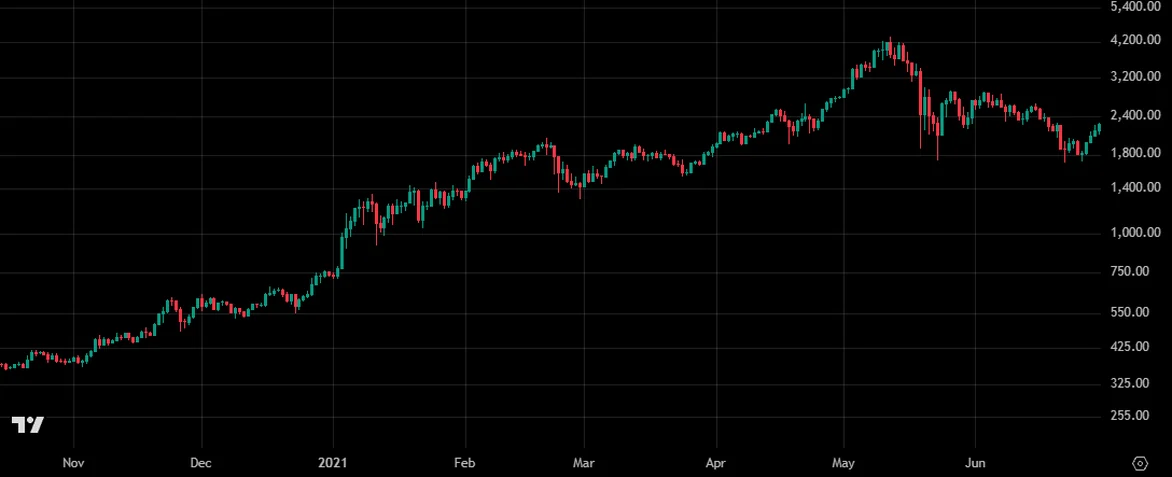
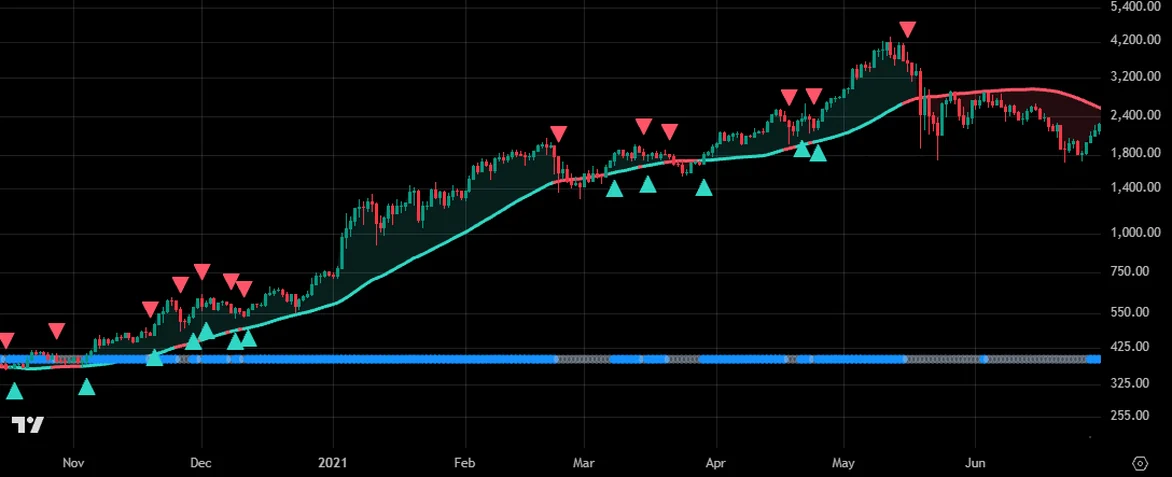
Calculated from historical data. Future returns are not guaranteed.ETHUSDT · 1D · 2020.10–2021.06Chart: TradingView
ProblemYou hold through a crash hoping it will come back
FixWhen either price (50-day line) or volume (OBV vs its 20-day average) breaks, ▼ OUT moves you to cash so you don't take the full fall
ProblemYou can't tell a price-only bounce from a rally with real volume
Fix▲ RIDE comes only when the close is above the 50-day tide line and OBV is above its 20-day average, so you ride rallies volume is backing
ProblemYou stare at the chart all day not knowing when the conditions will line up
FixThe bottom-right panel shows the distance to the next signal and ✓/✗ for both conditions, and an alert fires when a signal comes
The 50-day tide line turns teal while you hold and coral while you wait in cash, and blue dots under the bars show whether volume (OBV) is backing the move.
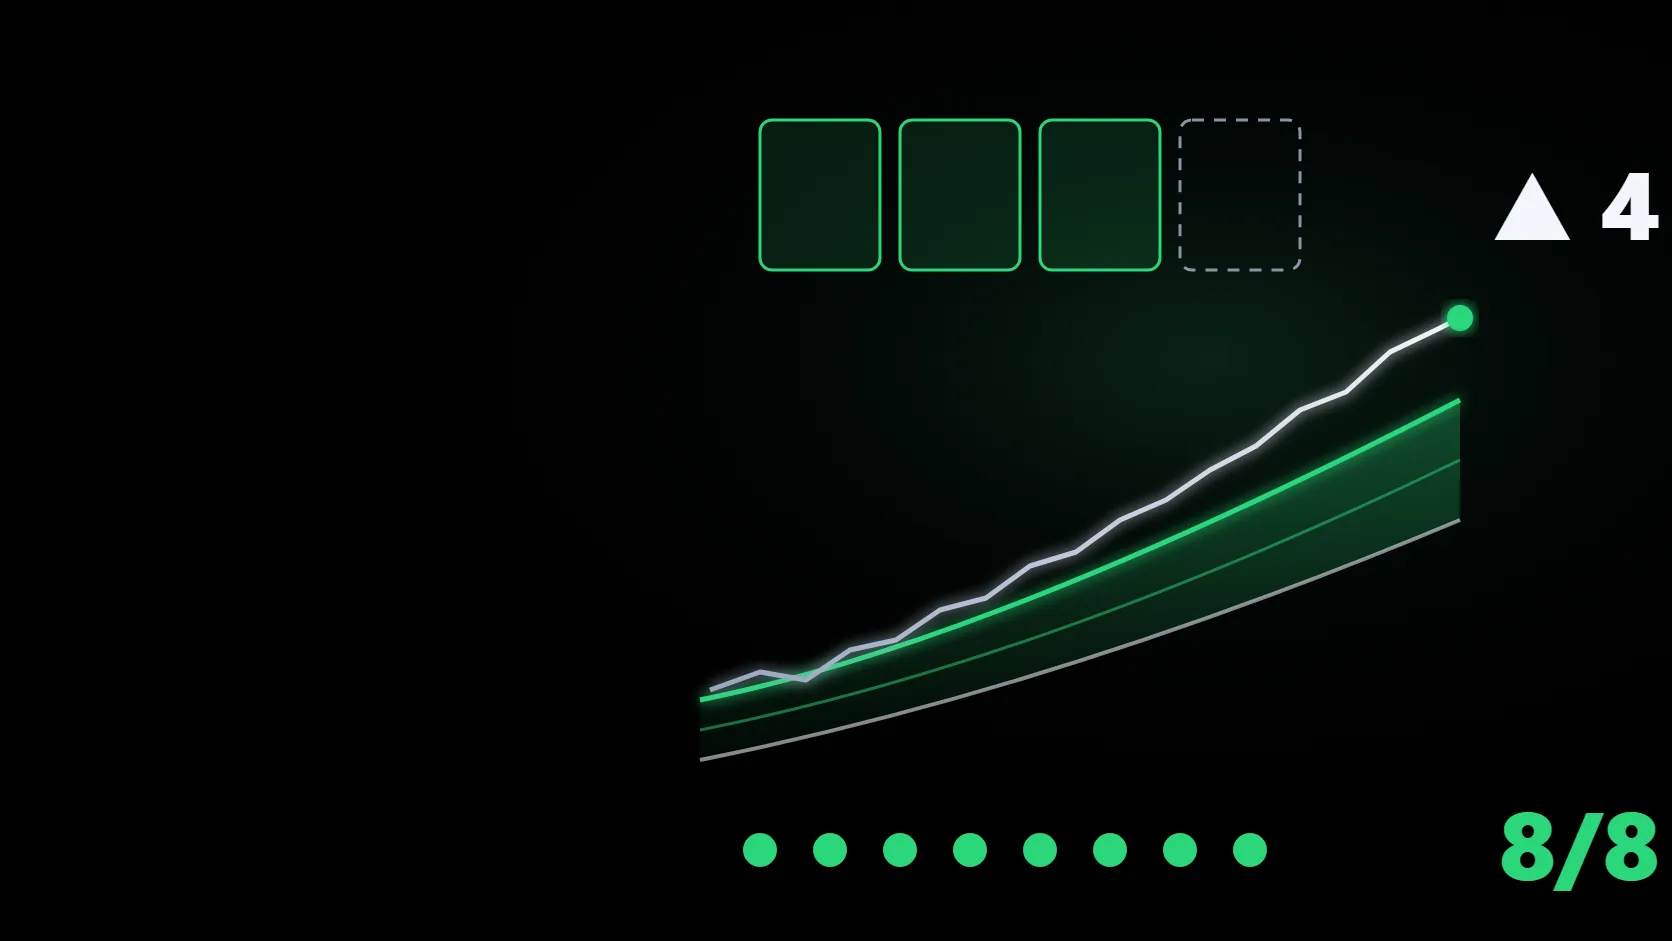
One bottom-right panel shows the distance to the next signal (e.g. +1.5% to buy), a 10-step progress bar, ✓/✗ for both conditions, where you are now and the last signal.
▲ RIDE and ▼ OUT are set only on the daily close, so past signals never change later. 8-language panel and alerts for both signals.
Coin or cash only, no leverage, recorded through October 24, 2026.
| Start | Plain holding | Volume Tide | Worst drop (holding → Tide) |
|---|---|---|---|
| BTC 2015 | $256,747257× | $462,601463× | −83.4%−51.2%▲32.2%pavoided |
| BTC 2018 | $5,9936.0× | $25,99526.0× | −81.5%−51.2%▲30.3%pavoided |
| BTC 2020 | $11,22311.2× | $15,99816.0× | −76.7%−51.2%▲25.5%pavoided |
| BTC 2022 | $1,6861.7× | $2,4402.4× | −67.0%−45.2%▲21.8%pavoided |
| ETH 2018 | $3,1403.1× | $21,35621.4× | −94.0%−50.1%▲43.9%pavoided |
| ETH 2022 | $6300.6× | $1,4241.4× | −74.0%−43.9%▲30.1%pavoided |
Big crypto declines, plain holding vs following the Volume Tide rule (peak → low, 0.1% cost per buy and sell).
With the indicator −20.2%
Ethereum Jan–Dec 2018 crash — plain holding −94.0%. ▼ OUT came 3 days after the top; the rule spent 91% of the decline in cash.
With the indicator −22.3%
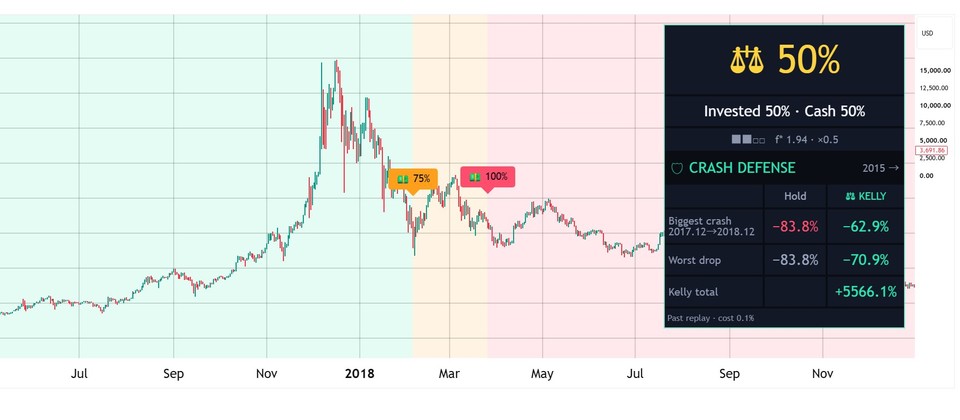
Bitcoin Dec 2017–Dec 2018 crash — plain holding −83.4%. ▼ OUT came 4 days after the top; the rule spent 85% of the decline in cash.
With the indicator −22.6%
Bitcoin Oct 2025–Jun 2026 decline — plain holding −53.1%. ▼ OUT came 4 days after the top; the rule spent 75% of the decline in cash.
No monthly subscription: one payment and the full Pine Script v6 source is yours to keep and modify.
Past performance does not guarantee future results.
Independent ChartArmory build of the public OBV idea popularized by Joseph Granville; not affiliated with or endorsed by Granville or his estate.
A signal on a closed bar never changes; only today’s unfinished bar can move.
Other symbols and higher timeframes use only data available at that moment, so no future values leak into past signals.
Past examples are calculated after trading costs (0.1% per side), and you can download the raw data as JSON.
The exact names you see in TradingView’s settings (Inputs tab).8 languages supported
A teal 50-day tide line means a holding phase, coral means cash. Blue dots under the bars tell you whether volume is backing the move.
In the panel, look at ✓/✗ for the price and volume conditions and how many percent remain to the next signal.
Most days you just look and move on. Buy or sell the next day only when the daily close confirms ▲ RIDE or ▼ OUT.
Hiring a developer usually costs $2,000–$5,000+ and weeks of building and testing. Here, one payment gets you tested Pine Script v6 source right away, yours to keep.
Let Volume Tide decide when to hold and when to wait in cash, and Kelly Meter how much to put in.
View indicatorEach indicator is sold separately; combined results have not been tested.
OBV (On-Balance Volume) is a running total that adds the day's volume when the price closes higher and subtracts it when it closes lower. Joseph Granville popularized it in his 1963 book Granville's New Key to Stock Market Profits, with the view that volume moves first and price follows.
The win rate is low, about 30%, and it trades 15–20 times a year. It takes many small losses (Bitcoin since 2018: −2.8% on average) and earns on a few big rallies (+14.9% on average), so it holds only about 39% of the time. From 2024, Bitcoin plain holding did slightly better (1.82×) than the rule (1.77×).
Tested on stocks and index ETFs (SPY, QQQ), the same rule fell well behind plain holding. On Bitcoin and Ethereum it matched or beat holding with far smaller worst drops. On a non-crypto chart the panel shows a warning.
No. They are the first values tested, and in all 9 nearby combinations Bitcoin's worst drop stayed smaller than plain holding.
No. Signals appear only after the daily close confirms them, so they never repaint. It moves between holding the coin and cash only: no leverage, no shorting, and it places no orders.
You can edit it for personal use. Sharing, redistribution and resale rights are not included.
Put the full source of Volume Tide, which shows the distance to the next signal every day, on your TradingView chart now.
Crypto cloud trend tool
Bitcoin cycle tool
TREND + HEAT SIZING
Breakout step checker
PULLBACK TREND
POSITION SIZER
LEADER ROTATION
TOP WARNING
CRASH BUYING
POSITION SIZING
TREND BREAKOUT
VOLATILITY BREAKOUT
LONG-TERM TREND
REBOUND OBSERVATION
BREAKOUT OBSERVATION
LIVERMORE · V3
TREND OBSERVATION
TradingView